amibroker

HomeKnowledge Base

Make icons larger on high DPI displays

When running AmiBroker on high-DPI displays like Retina screens, 4K screens or small tablets with hi-res displays the toolbar icons may become so small that they are difficult to use.

To solve the problem you need to choose Tools->Customize menu to display Customize dialog, go to Options tab and
select Large Icons check box as shown in the picture below.

Options page, Large Icons

How to backfill all symbols in RT database

Various data sources have different backfill capabilities, therefore the procedure to backfill all symbols varies. There are three categories of data sources, those that offer:

  1. unlimited backfills (eSignal, IQFeed),
  2. limited, 1-symbol at a time backfill (Interactive Brokers),
  3. no backfill at all (for example DDE)

As a general rule, all real-time data sources provide backfills on-demand, which means that backfill for each symbol has to be requested separately. If data source provides backfill and there are missing quotes in the database, AmiBroker will automatically request backfill on first access to given symbol. So, as soon as you display its chart fresh data will be requested and backfilled. Backfill is not immediate, because it is Internet-based process that involves request-response procedure, so data are requested from external server and arrive in a few seconds or so.
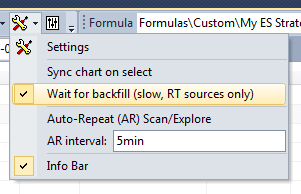
The same procedure is performed when doing any access including running Analysis, so backfill is requested as soon as given symbol is accessed, but by default Analysis window will not wait until backfill data arrive unless you turn on the Wait for backfill option (provided that data source supports it).

Wait for backfill option

It is worth to note that not all data sources support this feature. It needs to be handled by the data plugin, and many 3rd party plugins do not offer this.

If you are using eSignal or IQFeed or other data source with automatic, unlimited backfill you can use procedure described in How to use Real-Time data sources tutorial.

If you are using Interactive Brokers then the procedure is differnet since Interactive Brokers puts lots of limitations on backfills. To learn how to backfill all symbols using Interactive Brokers please read this dedicated tutorial on IB.

If you are using data source that does not offer any backfill, the only option is to use ASCII import to import the historical data from text files.

How to display Range Bars

The Range Bars are price-driven bars, with each bar having a required minimum high-low range. Source data are consolidated into one bar until the range requirement is reached, then a new bar is started.

AmiBroker fully supports range-bar type of charting and the bar size is based on the TickSize of given symbol. This allows to define symbol-specific tick sizes individually, them display a chart which for example shows 10R bars (meaning bars using a range of 10-ticks for each symbol respectively).

To display range charts, first you need to specify the TickSize in the Symbol–>Information window.
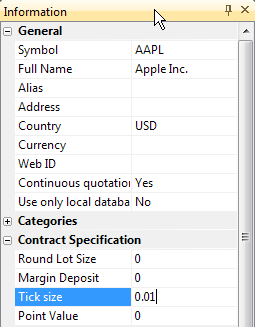
Information window

This can be done manually as shown above, however in case of larger group of symbols it is also possible to use ASCII Importer for this purpose (more details about ASCII imports can be found here: http://www.amibroker.com/guide/d_ascii.html).

Once TickSize has been defined, then in order to display chosen range chart, the easiest way is to use Interval box in the toolbar and just type-in the desired bar size. For example, to select the range bar of 10-ticks, one can type-in 10R in the toolbar:
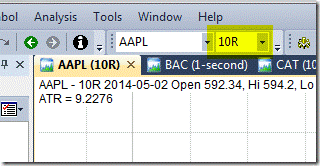
Range bar selection

Custom range intervals can also be defined in Tools–>Preferences, Intraday tab:
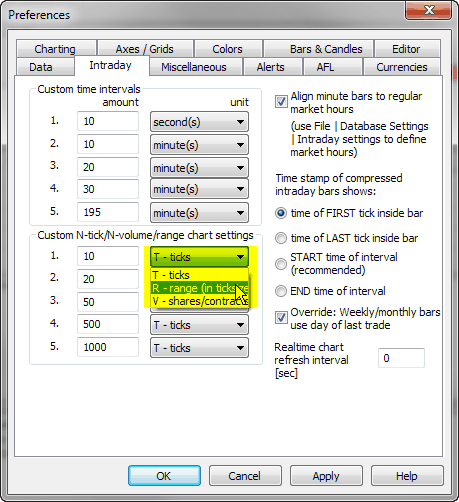
Preferences window

Then the pre-defined interval can be selected from View->Intraday menu.

It is worth noting that for best results, your database should use Tick as Base Time Interval, as then each trade is represented by an individual record in the database and can be consistently compressed to range bars. Using higher-interval data (such as 1-minute) may produce bars that are not perfect, especially if 1-minute bar high-low difference is comparable with selected range.

How to display Bond and Bill prices in fractions

Treasury Bond and Bill futures are traded in fractions, not decimals. A typical bond quote may be 124’21 which means 124 and 21/32nds, so one needs special method to display prices in non-decimal format.

To achieve desired result we need to do two things.

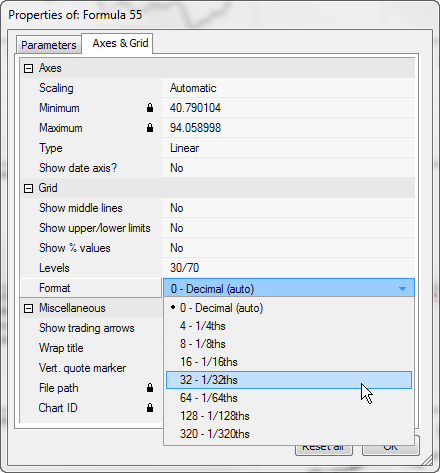
1. Switch Y axis grid to desired fraction format. To make a change, right click on the chart and select Parameters, then switch to Axes & Grid tab and change Grid Format as shown below:

Parameter Window

2. Create a price chart with custom title showing fractions instead of decimals. Go to Analysis->Formula Editor, enter the following formula and press Apply Indicator toolbar button.

function NumToFracnum )
{
  return 
StrFormat("%.0f'%0.f"floornum ), fracnum ) * 320 );
}
PlotClose"Close"colorDefaultstyleCandle);
Title "{{NAME}} - {{INTERVAL}} {{DATE}} Close: " NumToFracClose )

The NumToFrac function formats decimal value into full points and 1/320nds fraction of the full point.

How to display the indicators based on Advances/Declines

IMPORTANT: The article below applies ONLY TO LOCAL DATABASES. If you are using ANY plugin-driven database (eSignal, IQFeed, Premium Data, Norgate, Interactive Brokers or whatever other 3rd party plugin), then you SHOULD NOT use “calculate composites” tool. Instead use composite symbols that are provided by data vendor. Contact data vendor to learn what symbols given data vendor uses, because composite symbols are NOT standarized and vary from vendor to vendor

In order to display indicators based on Advances/Declines first of all it’s necessary to calculate composities in the database:

  1. Open Categories window using Symbol->Categories menu item.
  2. Select base index for given market in Markets tab and Base indexes for – Composites combo.
    For example if you are following NYSE this can by ^DIJ (Dow Jones Average)
    (certain symbol must be marked as index in Symbol -> Information and must belong to the same market)

  3. Choose Symbol ->Calculate composites  menu item to open the window shown below and mark:
    – Number of advancing/declining issues and
    – Apply to: all quotes, All markets

  4. Click Calculate . From now on ADLine, AdvVolume() and TRIN indicators will be visible.

Q: Why does AB need “base index”?
A: Just because it may happen that not all stocks are quoted every businness day and AB needs must calculate number of advancing/declining issues per market. So it checks the “base index” quotations dates and tries to find corresponding quotes of all stocks belonging to that market to find out how many issues advanced, declined and not changed at all.

Q: What are “Volume for base index” and “Copy volume to all indexes” checkboxes for?
A: “Volume for base index” and “Copy volume to all indexes” are provided in case you DON’T have real volume data for index quotes. In that case AmiBroker can calculate volume for index as a sum of volumes of all stocks belonging to given market. First option assigns calculated volume only to “base index”, the second copies the volume figure to all indexes belonging to given market.

How to make vertical selection line thinner

AmiBroker 4.90 now has thick vertical selector line that plots behind chart lines to improve clarity and readability (selector does not cover candlesticks). Some users however prefer thin, single-pixel line. There is an easy way to switch. (more…)

How to save layouts that hold individual parameter values for different symbols.

By default the values of parameters for given indicator pane are the same (shared) for all symbols. If you want per-symbol parameters, you need to apply technique descibed in this short article. (more…)

« Previous Page