October 5, 2015
How to browse charts in selected date range
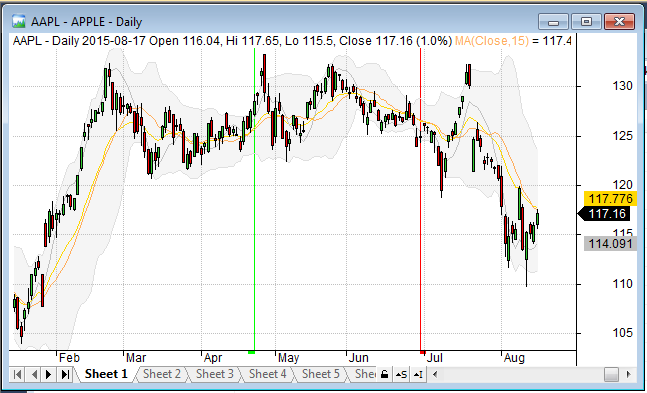
In order to select certain range of dates in the historical chart, then scroll through the history of tickers, we can mark the range of dates we interested in using Range Markers (double-click on the chart or mark the bars and hit F12, SHIFT+F12).

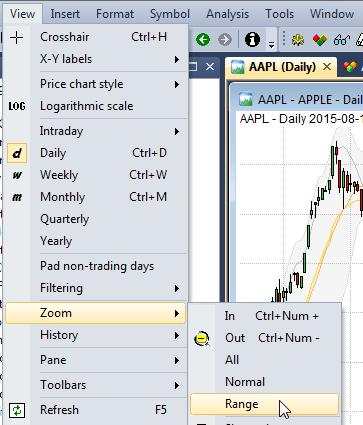
Then, use View->Zoom->Range menu to zoom the chart to our range selection.

We can also assign a keyboard shortcut to View->Zoom->Range command or create a custom toolbar button to have it easily accessible (e.g. CTRL+SHIFT+R). This can be done in Tools->Customize (http://www.amibroker.com/guide/h_customizeui.html)
After we switch the symbol, in situations when the chart shifts e.g. due to different history length in those symbols – all we have to do is to hit CTRL+SHIFT+R to bring back the view to the range we wanted.
Browsing through the list of symbols can be automated further with scripts. Below is a sample auto-play script that will automatically browse through the list of symbols and will set the zoom to the dates we set in the code. All we need is just to start the script and watch it all switching automatically, without any manual actions required.
Here is a sample script that will browse through the list of symbols and set the zoom to show year 2010:
iWatchList = 0; /* you can define watch list number here */

AB = new ActiveXObject( "Broker.Application" );
Qty = AB.Stocks.Count;

for ( i = 0; i < Qty; i++ )
{
    Stk = AB.Stocks( i );

    if ( iWatchList < 32 )
    {
        if ( Stk.WatchListBits & ( 1 << iWatchList ) )
        {
            AB.ActiveDocument.Name = Stk.Ticker;
            AW = AB.ActiveWindow;
            AW.ZoomToRange( "2010-01-01", "2011-01-01" );
            WScript.Sleep( 2000 ); // 2 seconds delay
        }
    }
    else
    {
        if ( Stk.WatchListBits2 & ( 1 << ( iWatchList - 32 ) ) )
        {
            AB.ActiveDocument.Name = Stk.Ticker;
            AW = AB.ActiveWindow;
            AW.ZoomToRange( "2010-01-01", "2011-01-01" );
            WScript.Sleep( 2000 ); // 2 seconds delay
        }
    }
To use above code follow these steps:
- Open Notepad
- Copy-paste above the code
- Save the file with .JS extension (which means that system will treat this as JScript code)
- Make sure that AmiBroker is running with desired chart as active one
- Double click on .JS file to execute the JScript code
IMPORTANT: if you are running 64-bit Windows and have BOTH 32-bit and 64-bit versions of AmiBroker installed the OLE scripts by default would only talk to 64-bit instance. To use 32-bit version instead you would need to follow advice given in this article: http://www.amibroker.com/kb/2015/01/12/ole-automation-scripts-with-32-and-64-bit/
It is worth noting that going through series of charts is not the only way to compare performance of various symbols over time. There are other dedicated built tools for comparing several securities (without switching symbols, but within one chart window), including Price (Foreign) and Relative Performance indicator. These functionalities are shown in the following video:
http://www.amibroker.com/video/TwoSymbolsOneChart.html
 Filed by Tomasz Janeczko at 7:04 am under Charting
Comments Off on How to browse charts in selected date range
 3 Comments