amibroker

HomeKnowledge Base

How to measure price / percentage distance on the chart

The easiest way to manually measure distance between two points on the chart is to use a regular trend-line drawing tool for this purpose.

First we need to draw the line between the selected points (Insert->Trendline). It may be useful to have Insert->Snap to Price option marked if we want our line to start and end exactly at OHLC levels of respective price bar.

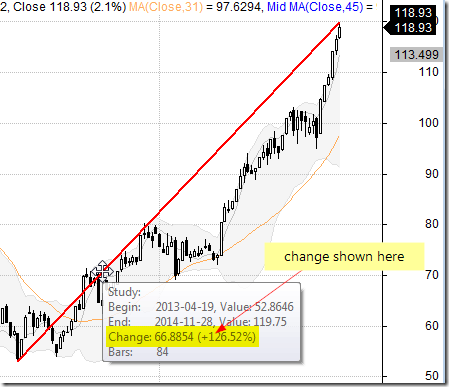
Once trend line is drawn, we need to hover the mouse cursor over the line and the tooltip will show both price and percentage change between the Start and End points:

Measure distance

How to restrict trading to certain hours of the day

In order to include time-based conditions in the back-testing code – we can use TimeNum() function to check the time-stamp of given bar and use it as input for any time-based conditions.
http://www.amibroker.com/f?timenum

In order to code a strategy that triggers trades only in certain hours of the day, 9:30-11:00 in this example, we can use the following approach (code uses simple MACD crossovers to generate signals):

tn TimeNum();
startTime 93000// start in HHMMSS format
endTime 110000;  // end in HHMMSS format
timeOK tn >= startTime AND tn <= endTime;

Buy CrossMACD(), Signal() ) AND timeOK;
Sell CrossSignal(), MACD() ) AND timeOK

It is also possible to force an exit signal after 11:00 to avoid overnight positions:

tn TimeNum();
startTime 93000// start in HHMMSS format
endTime 110000;  // end in HHMMSS format
timeOK tn >= startTime AND tn <= endTime;

Buy CrossMACD(), Signal() ) AND timeOK;
Sell = (CrossSignal(), MACD() ) AND timeOK) OR CrosstnendTime ); 

How to synchronize backtesting setup on different computers

When comparing the output of back-tests obtained from different working machines, it is necessary to make sure that all aspects of our testing are identical, including:

  1. the database
  2. the formula used for testing
  3. the settings

In order to synchronize data – the best is to copy the entire local database folder. Using just the same data source, especially if it is real-time feed may not be enough due to different array lengths or some corrections that may have been applied in historical data on data-vendors server in between.

In case of any differences in results between two computers that is the very fist thing to check, as different input would result in different output.

To find out that the data are different you may simply create a checksum of data columns, using code like shown below:

Filter Status("lastbarinrange");
AddColumnCumHigh Low Close Open ), "Price checksum");
AddColumnCumVolume ), "Volume checksum" );
AddColumnBarIndex(), "Number of bars");
AddSummaryRows); // add total sum of column

By running this code on both computers you can compare checksums to see if they are the same.

In order to transfer the formula and settings to the other machine it is enough to:

  1. select Analysis window
  2. use File->Save from the main menu and save the APX file
  3. open the same APX file on the other computer

If data, code and settings are identical, then the obtained results will also stay in sync.

Handling limit orders in the backtester

In order to simulate limit orders in backtesting it is necessary to check in the code if Low price of the entry bar is below the limit price we want to use. The following example shows an entry signal based on Close price crossing over 100-period simple moving average. The position is opened on the next bar if price drops 1% below the Close of signal bar.

BuySignal CrossCloseMA(Close100 ) );

// buy on the next bar
Buy RefBuySignal, -1);
BuyLimitPrice RefClose, -1) * 0.99;

// now we check if limit was hit
Buy Buy AND BuyLimitPrice;

// if Open price is below the limit, then we use Open for entry
BuyPrice MinOpenBuyLimitPrice )

If we want the order to be valid for more than one bar, then we can use Hold function for this purpose:

BuySignal CrossCloseMA(Close100 ) );

// buy on the next bar
Buy RefBuySignal, -1);
BuyLimitPrice ValueWhen(BuySignalClose) * 0.99;

// now we check if limit was hit
Buy HoldBuy) AND BuyLimitPrice;

// if Open price is below the limit, then we use Open for entry
BuyPrice MinOpenBuyLimitPrice )

In a portfolio-level backtest we usually advocate against using limit orders. Why? Simply because we may not have enough cash in your account to place limit orders for all possible entry candidates. If your trading system generates 100 possible entries, you would need to place 100 limit orders only to find out that eventually only few of them fired. With limited buying power, we may need to place limit orders only for the top N-scored tickers that have generated BuySignal and skip the others. To simulate the situation when we only place small set of limit orders for top ranked stocks we can use new ranking functionalities introduced in AmiBroker 5.70. Knowing the rank at this stage is required if we only want to allow orders for top-scored tickers. Let us say that we prefer symbols with smallest RSI values.

The code would look the following way: Formula first generates a ranking for all tickers included in the test (below example uses Watchlist 0), then when testing individual symbols – checks the pre-calculated rank and generates Buy signal based on that reading.

// we run the code on WatchList 0
List = CategoryGetSymbolscategoryWatchlist);
SetOption("MaxOpenPositions"3);

if ( 
Status("stocknum") == // Generate ranking when we are on the very first symbol
{
     
StaticVarRemove"values*" );

     for ( 
0; ( Symbol StrExtract( List, ) )  != "";  n++    )
     {
         
SetForeign symbol );

         
// value used for scoring
         
values 100 RSI();
         
RestorePriceArrays();
         
StaticVarSet (  "values"  +  symbolvalues );
         
_TRACEsymbol );
     }

     
StaticVarGenerateRanks"rank""values"01224 );
}

symbol Name();
values StaticVarGet "values" +  symbol );
rank StaticVarGet "rankvalues" +  symbol );

PositionScore values;

BuySignal CrossCloseMA(Close100 ) );

// buy on the next bar
Buy RefBuySignal, -1);
BuyLimitPrice RefClose, -1) * 0.999;

// now we check if limit was hit for the symbols ranked as top 3
Buy Buy AND BuyLimitPrice AND rank <= 3;
BuyPrice MinOpenBuyLimitPrice );

// sample exit rules - 5 - bar stop
Sell 0;
ApplyStopstopTypeNBarstopModeBars51)

Detailed description of the ranking functionality used above is available in the manual at: http://www.amibroker.com/guide/h_ranking.html

Using loops with TimeFrame functions

AmiBroker features a powerful set of TimeFrame functions that allow combining different time intervals in single system formula. There is one aspect of TimeFrame functions that is important to understand to properly use them. When we switch to higher interval using TimeFrameSet function – the BarCount does not really change – TimeFrameSet just squeezes the arrays so we have first N-bars filled with Null values (undefined) and then – last part of the array contains the actual time-compressed values. This is explained in details here: http://www.amibroker.com/guide/h_timeframe.html

Normally it does not present any problem as long as we use array functions, because array functions check for Nulls occuring at the beginning of the data series and skip them appropriately. The story is different when we try to use loops.

If we want to use looping code in higher time-frame, we can not really start our calculations from the bar 0, because it would contain Null instead of real data. That is why we would first need to detect were the actual compressed data begins and start calculations on that particular bar instead.

Here is a sample formula showing how to compute AMA function in a loop, based on weekly data (the code should be applied in Daily interval). Code will identify the first non-Null bar and initialize the first AMA value with Close of that bar, then it will continue calculations

PlotClose"Close"colorBlack );

// switch to higher timeframe
TimeFrameSetinWeekly );

smooth 0.2;
myAMA Close;

// search for start (non-null) bar
for( start 0start BarCountstart++ )
{
   if( 
NOT IsNullClosestart ] ) ) break;
}

// looping code
for ( start 1BarCounti++ )
{
    
// this part will execute only after the first non-null bar has been identified
    
myAMA] = Close] * smooth myAMA] * ( smooth );
}

// regular AMA function for comparison
weeklyAMA AMAClose0.2 );

//restore original time-frame
TimeFrameRestore();

// plot expanded values retrieved from Weekly frame
PlotTimeFrameExpandmyAMAinWeekly ), "weekly AMA loop"colorRed );
PlotTimeFrameExpandweeklyAMAinWeekly ), "weekly AMA"colorBluestyleDots )

The code above is good for pre-5.90 versions. In version 5.90 we have a new function that counts Nulls for us making the code shorter and clearer, as shown below:

Version5.90 );

PlotClose"Close"colorBlack );

// switch to higher timeframe
TimeFrameSetinWeekly );

smooth 0.2;
myAMA Close;

// new 5.90 function that counts leading Nulls
start NullCountClose );

// looping code
for ( start 1BarCounti++ )
{
    
// this part will execute only after the first non-null bar has been identified
    
myAMA] = Close] * smooth myAMA] * ( smooth );
}

// regular AMA function for comparison
weeklyAMA AMAClose0.2 );

//restore original time-frame
TimeFrameRestore();

// plot expanded values retrieved from Weekly frame
PlotTimeFrameExpandmyAMAinWeekly ), "weekly AMA loop"colorRed );
PlotTimeFrameExpandweeklyAMAinWeekly ), "weekly AMA"colorBluestyleDots )

How to display indicator values in the backtest trade list

Backtesting engine in AmiBroker allows to add custom metrics to the report, both in the summary report and in the trade list. This is possible with Custom Backtester Interface, which allows to modify the execution of portfolio-level phase of the test and (among many other features) adjust report generation.

Due to the fact that the report generation occurs in 2nd phase of the test, when the backtester works on ~~~EQUITY ticker, we can not refer directly to given indicators. For example, to display ATR values – calling ATR() function directly is not enough, because we want to see ATR values of the traded symbol, while in portfolio-phase of the test we are no longer working on that symbol’s quotes.

So, we need to:

  1. store the values of indicators in static variables in the 1st phase of the test (when individual symbols are processed). This can be done with static variables, creating separate static variable for each symbol
  2. read stored values once the backtester reaches the portfolio phase of the test.

The following formula shows how this can be coded. The formula below displays the value of ATR indicator for the entry bar of given trade:

SetCustomBacktestProc"" );

if ( 
Status"action" ) == actionPortfolio )
{
    
bo GetBacktesterObject();
    
// run default backtest procedure without generating the trade list
    
bo.BacktestTrue );

    
// iterate through closed trades
    
for ( trade bo.GetFirstTrade( ); tradetrade bo.GetNextTrade( ) )
    {
        
// read ATR values and display as custom metric
        
symbolATR StaticVarGettrade.Symbol "ATR" );
        
trade.AddCustomMetric"Entry ATR"LookupsymbolATRtrade.EntryDateTime ) );
    }

    
// iterate through open positions
    
for ( trade bo.GetFirstOpenPos( ); tradetrade bo.GetNextOpenPos( ) )
    {
        
// read ATR values and display as custom metric
        
symbolATR StaticVarGettrade.Symbol "ATR" );
        
trade.AddCustomMetric"Entry ATR"LookupsymbolATRtrade.EntryDateTime ) );
    }

    
// generate trade list
    
bo.ListTrades( );
}

// your trading system here
Buy CrossMACD(), Signal() );
Sell CrossSignal(), MACD() );

// assign indicator values to ticker-specific variables
StaticVarSetName() + "ATR"ATR15 ) )

How to plot daily High and Low on intraday chart

The AFL offers a set of time-frame functions which allow to use multiple intervals within a single formula (the topic is explained in details in the following tutorial chapter: http://www.amibroker.com/guide/h_timeframe.html)

In situations, where we do not need to calculate any indicators based on higher interval data, but rather just read OHLC, V or OI arrays – TimeFrameGetPrice is the most convenient function to use.

To plot daily High and Low levels we just need to read the respective arrays calling: TimeFrameGetPrice(“H”, inDaily ) – the first argument specifies the array we want to read, the second argument defines the interval we are reading data from. As with any other TimeFrame functions – we can only read data from higher intervals, so it is possible to read daily data when we work with 1-minute quotes, but not the other way round.

Here is a sample formula which draws daily high and low in the intraday chart:

PlotClose"Close"colorDefaultstyleBar );
PlotTimeFrameGetPrice("H"inDaily ), "day high"colorGreenstyleStaircase styleThick);
PlotTimeFrameGetPrice("L"inDaily ), "day low"colorRedstyleStaircase styleThick)

TimeFrameGetPrice() functions allow also to easily shift the reading by N-bars of the higher interval if we specify that in 3rd argument of the function, so calling TimeFrameGetPrice( “H”, inDaily, -1 ) will return the high of previous day.

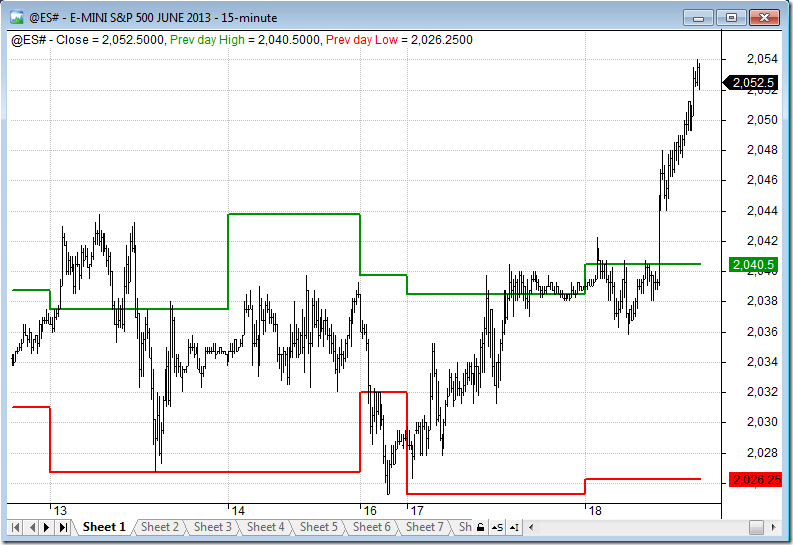
The following code draws high / low of previous day on top of the intraday chart:

PlotClose"Close"colorDefaultstyleBar );
hlstyle styleStaircase styleThick;
PlotTimeFrameGetPrice"H"inDaily, -), "Prev High"colorGreenhlstyle );
PlotTimeFrameGetPrice"L"inDaily, -), "Prev Low"colorRedhlstyle )

Daily H-L

How to export quotes to separate text files per symbol

The following KB article: http://www.amibroker.com/kb/2006/03/04/how-to-export-quotations-from-amibroker-to-csv-file/ already explained how to use exploration to export quotes into a single text / CSV file.

If, for some reason, we need individual files for each symbol, AmiBroker offers another way of writing data to text files. This can be achieved by using fputs function that would write directly to external files. Using fputs allows us also to fully control formatting of the output data and file naming can be dynamically set based on Name() function output.

To perform the export procedure, we need to run a Scan over the list of symbols we want to export data for.

In the Analysis->Formula Editor please enter the following code:

// create folder for exporting purposes
fmkdir"C:\\DataExport\\" );

// open file for writing
// file name depends on currently processed ticker
fh fopen"c:\\DataExport\\" Name() + ".txt""w" );

// proceed if file handle is correct
if ( fh )
{
    
dt DateTime();

    
// write header line
    
fputs"Ticker,Date/Time,Open,High,Low,Close,Volume\n"fh );

    
// iterate through all the bars

    
for ( 0BarCounti++ )
    {
        
// write ticker name
        
fputsName() + "," fh );

        
// write date/time information
        
fputsDateTimeToStrdt] ) + ","fh );

        
//write quotations and go to the next line
        
qs StrFormat"%g,%g,%g,%g,%g\n"O], H], L], C], V] );
        
fputsqsfh );

    }
    
// close file handle
    
fclosefh );
}
 
// line required by SCAN option
Buy 0

Now please select Tools->Send to Analysis, select the list of symbols (e.g. Apply To: Filter, pick the watchlist in the Filter dialog), set Range to All Quotations, and press Scan

How to add exploration results to a watchlist

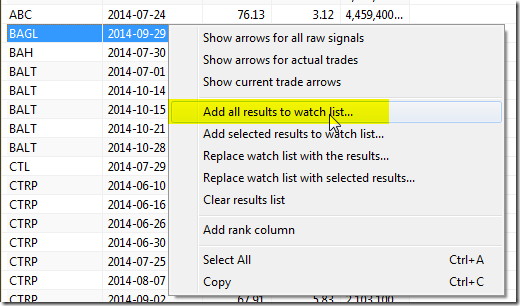
In order to add analysis results to a selected watchlist manually, we can use context menu from the results list:

Add results to watch list

There is, however, a way to automate this process and add the symbols to a watchlist directly from the code. To do so, we need to:
– check if our Filter variable was true at least once in the tested Analysis range
– based on the above condition, use CategoryAddSymbol() function to add tickers to a watchlist.

Additionally, we can erase the watchlist at the beginning of the test if we want to store just the new results.

The code below shows how to implement this procedure in AFL.

listnum 10// we use watchlist 10 for storing results

// erase the watchlist when we process very first symbol
if ( Status"stocknum" ) == )
{
    
// retrieve watchlist members
    
oldlist CategoryGetSymbolscategoryWatchlistlistnum );

    
// iterate through the list and remove tickers
    
for ( 0; ( sym StrExtractoldlist) ) != ""i++ )
    {
        
CategoryRemoveSymbolsymcategoryWatchlistlistnum );
    }
}

// sample exploration code
Filter ROCClose) > AND Volume 1000000;
AddColumnClose"Close" );
AddColumnROCClose), "ROC" );
AddColumnVolume"Volume" );

// check how many times Filter variable was true in the tested range
// if non-zero value detected, add current symbol to a watchlist
if ( LastValueCumFilter AND Status"barinrange" ) ) )  )
    
CategoryAddSymbol""categoryWatchlistlistnum )

How to configure alerts to work with SSL e-mail accounts

In order to send e-mail alerts to accounts requiring SSL (secure socket layer) connection you need to follow these steps:

  1. Download and run SSL add-on from: http://www.amibroker.com/bin/SSLAddOn.exe.
    Extra steps for 64-bit installs only: By default EMailerSSL.exe program is installed into AmiBroker 32-bit installation folder – but it is also possible to use it with 64-bit version of AmiBroker with some additional steps:

    1. Create C:\Program Files (x86)\AmiBroker folder (if 32-bit version of AB is not installed)
    2. Run SSLAddOn.exe from the link above
    3. Copy EMailerSSL.exe from C:\Program Files (x86)\AmiBroker folder to C:\Program Files\AmiBroker folder

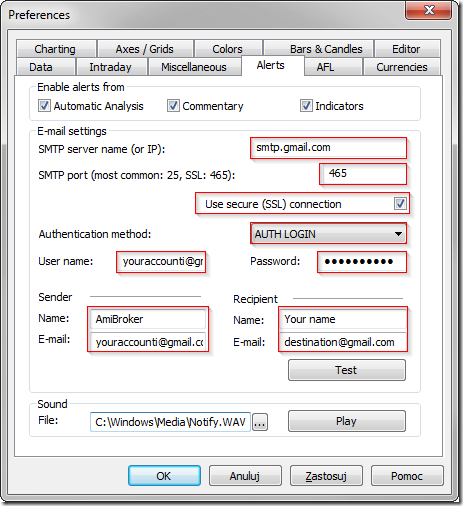
  2. Configure account in the Tools->Preferences->Alerts, for example GMail configuration looks as follows:

    Email alert configuration for GMail

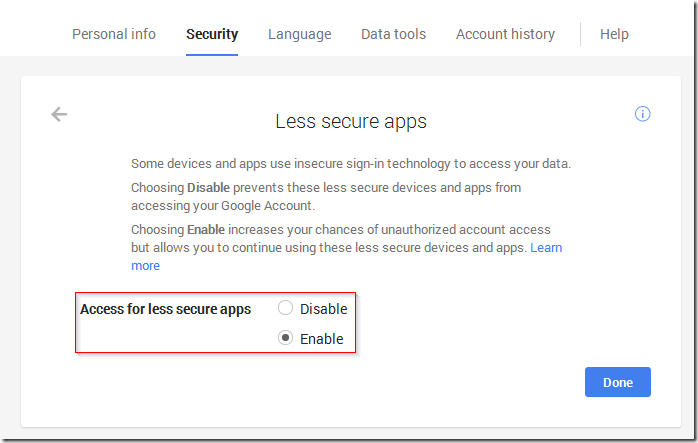
  3. In certain cases the e-mails may be blocked by default Gmail account settings. If the authentication fails with an error message, it may be required to visit: https://www.google.com/settings/security/lesssecureapps and switch Access for less secure apps to Enable as shown below:

    Email alert configuration for GMail

« Previous PageNext Page »