amibroker

HomeKnowledge Base

How to populate Matrix from a text file
AmiBroker 6.00 has introduced support for matrices. After we create a matrics with Matrix function call:

my_var_name Matrixrowscolsinitvalue)

then in order to access matrix elements, we need to use:
my_var_namerow ][ col ]

However – if we want to populate a relatively large matrix with values generated in other programs, then it may not be very practical to do it by hand in the AFL code assigning individual elements like this:

A][ ] = 1A][ ] = 4A][ ] = 6

What we can do in such case is to store the values in a text file that we could use as input, then read through the file using fgets function and populate Matrix elements using a looping code. A sample formula showing how to perform such task is presented below.

A sample text file for this example can be found here: http://www.amibroker.com/kb/wp-content/uploads/2015/10/samplematrix.txt

// the input file path
file "C:\\samplematrix.txt";

// define the size of the desired matrix
rows 16;
cols 16;

// create matrix
myMatrix Matrixrowscols);

// open file
fh fopenfile"r" );

if( 
fh )
{
    
0;

    
// iterate through the lines of input file
    
for( 0; ! feoffh ) AND rowsi++ ) 
    {
        
// read a line of text
        
line fgetsfh ); 

        if( 
line == "" )
        {
            
Error("Too few rows in the data file or an empty row found");
            break;
        }
    
        
// iterate through the elements of the line
        
for( 0; ( item StrExtractline) ) != "" AND colsj++ ) 
        {
            
// assign matrix element
            
myMatrix][ ] = StrToNumitem );
        }
        
        if( 
cols )
        {
            
Error("Too few columns in data file");
            break;
        }
    }
    
    
fclosefh );
}
else
{
    
Error"ERROR: file can not be opened" );
}

// spot check selected element
Title "spot check M[ 2 ][ 3 ]: " NumToStrMyMatrix][ ] )

How to add symbol labels to Relative Performance chart

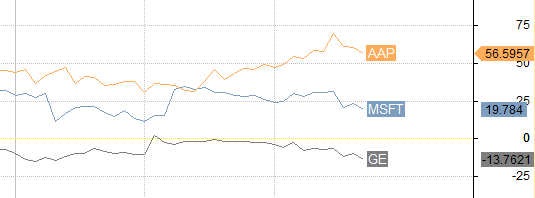
The built-in Relative Performance chart displays symbol names colored respectively in the chart Title. However – it may be practical to display the symbol label next to the plotted line for easier identification. This can easily be done with PlotText or PlotTextSetFont function.

A sample code showing such modification is presented below. Font size of the labels can be changed through Parameters dialog.

_NTickerList ParamStr"Tickers""^DJI,MSFT,GE" ) );
fontsize Param("Label font size"10430);
fvb Status"firstvisiblebar" );

for( 
0; ( symbol StrExtractName() + "," TickerList) ) != ""i++ )
{
    
fc Foreignsymbol"C" );

    if( ! 
IsNullfc] ) )
    {
        
relP 100 * ( fc fcfvb ] ) / fcfvb ];
        
PlotrelP symbolcolor colorLightOrange + ( ( ) % 15 ), styleLine );

        
LastValueBarIndex() ) + 1;
        
LastValuerelP );

        
PlotTextSetFontsymbol"Arial"fontsizexyGetChartBkColor(), color, -fontsize/);
    }
}

PlotGrid0colorYellow );
_NTitle "{{NAME}} - Relative Performance [%]: {{VALUES}}" )

Relative Performance with labels

How to backup data from an external source

There is a number of data-plugins, where AmiBroker reads quotes directly from an external database maintained by the data-vendor (such as TeleChart, FastTrack, PremiumData or other MetaStock-based sources). Depending on settings, AmiBroker may or may not keep a copy of such data in its own database. For in-depth explanation how it works see the following tutorial chapter:

http://www.amibroker.com/guide/h_workspace.html

Now, if we want to backup the data from an external data source, and use them offline, first we need to make sure that actual data are copied into AmiBroker’s local database.

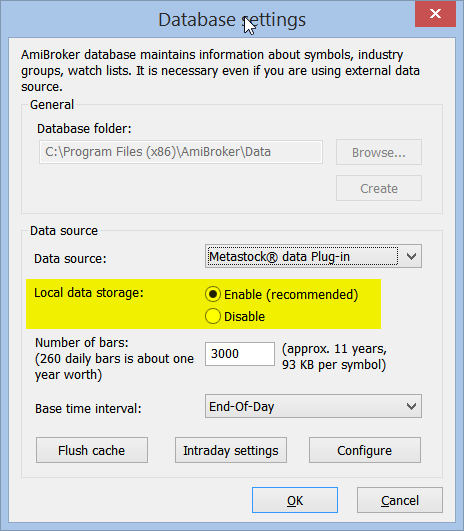
To do so, first go to File->Database Settings set Local Data Storage to Enabled. This instructs AmiBroker to keep its own copy of retrieved data.

Database Settings

At this point the data are not copied yet. In order to bring them from external data source to AmiBroker local database, we need to make sure that AmiBroker accesses quotes of all symbols at least once. Only then external source will be queried for data and that data will be copied to a local database. The easiest way to do so is to run a Scan from Analysis window over all symbols, using any scanning formula, even as simple as:

Buy 0

Such single-line of code can be entered in the Formula Editor, then selecting Tools–>Send to Analysis menu would bring up the Analysis window. At this point just make sure that Apply To is set to All Symbols and press Scan.

After this the data is copied to local database. If you want to completely disconnect from external data source, you can do so by changing Data source to “(local database)” in File->Database Settings. This would allow you to use the data on a different computer. Now you can do File->Save Database As… to store the database into new location (or backup drive).

If you want to re-connect to external data source, just switch the Data source back to original setting (i.e. the data plugin you were using before).

Choosing first day of the week for weekly compression

AmiBroker allows to define, what days to use for weekly compression. By default weekly compression uses Monday-Sunday week (i.e. Monday being the first day of the week), we can change it however to any custom day of the week to match our local calendar.

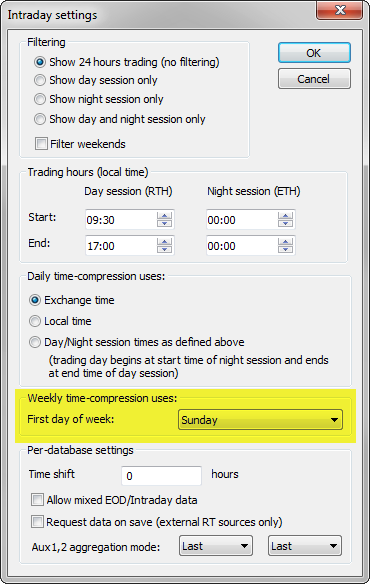
To choose the day to be used as the first day of the week, we need to go to File->Database Settings->Intraday Settings and choose the appropriate day in “First day of week” field.

Database Settings

The above example shows custom-defined week, which starts on Sunday and ends on Saturday (i.e. working Sunday-Thursday week, as in many Middle East countries).

The following Wikipedia article specifies the working week for a number of countries in the world:
http://en.wikipedia.org/wiki/Workweek_and_weekend

Customizing chart titles

When we create custom indicators in AmiBroker, then by default the program will automatically create chart title line based on the selected ticker and the information we have provided in Plot function calls.

If we use the following formula:
PlotClose"Close"colorDefaultstyleBar );
PlotMAClose20), "MA-20"colorRed );
PlotMAClose50), "MA-50"colorBlue )

Then the auto-generated chart title line will contain:

Chart title

First item is the symbol name selected for that particular chart window (BA in this case), then the output is based on the plot names (provided in the 2nd argument of Plot function calls within the code) and colors will also match the respective plot colors. Number of decimal places depends on the settings in Tools->Preferences->Miscellaneous: Decimal places in chart titles/tools

If we do not want certain plot to affect the chart titles, we can use styleNoTitle chart style, for example changing the 3rd line of the above code into:

PlotMAClose50), "MA-50"colorBluestyleNoTitle )

Would result in removing MA-50 values from the title output presented above, even though MA-50 values are still presented in the chart.

We can customize the chart title output even further by means of dedicated Title variable. If we define Title string within the formula, it will override the automatic title generation. Therefore, starting with most basic example, defining an empty string with use of:

Title ""

would hide the title output completely, while using statement like this:

Title "Close Price: " +NumToStrClose1.2 )

would generate default-color output such as the following (the price is formatted to use 2 decimal places by using NumToStr function in this case):

Chart title

It is also possible to define chart color by using EncodeColor() function, so changing the above line into:

Title "Close Price: " +EncodeColorcolorRed ) + NumToStrClose1.2 )

would result in displaying the price value (and other text that follows the EncodeColor call) in red color.

Now let us analyse the Title definition included in the built-in Price chart.

_N(Title StrFormat("{{NAME}} - " +FullName() +
   
" - {{INTERVAL}} {{DATE}} Open %g, Hi %g, Lo %g, Close %g (%.1f%%) Vol " +
   
WriteValV1.0 ) +" {{VALUES}}"OHLCSelectedValueROCC)) ))

Among other elements shown above, the Title definition uses templates like {{NAME}} or {{VALUES}} etc. in the defined string.

These are special tokens that are replaced by appropriate values at run-time:

  1. {{VALUES}} inside Title string will be replaced by automatic-values generated by Plot function calls
  2. {{NAME}} will be replaced by the ticker symbol
  3. {{DATE}} will be replaced by selected date
  4. {{INTERVAL}} will be replaced by the name of the interval
  5. {{OHLCX}} will be replaced at runtime by string “Open …, Hi …. Lo … Close (…%)” showing current price

The built-in title definition uses also StrFormat function. This function allows us to specify the string followed by the list of arguments that will be inserted into the string in places, where %f, %g or %e specifications are entered.

Chart title

If we use the code like the one above, it would produce the following output:

Chart title

Those specifications allow us to format the output string accordingly.

  • %.0f will output a number without decimal places (with rounding if necessary), such as 393
  • %.1f will output a number with 1 decimal place, such as 392.7
  • %.2f will output a number with 2 decimal places, such as 392.65
  • %.3f will output a number with 3 decimal places, such as 392.651
  • %.4f will output a number with 4 decimal places, such as 392.6510
  • %e will output scientific notation (mantissa/exponent), such as 3.92651e+2 (3.92651 * 10 ^ 2 )
  • %g uses automatic formatting and displays as many decimal places as required to show full precision of given number (392.651)

The documentation of the StrFormat function is available in the manual

http://www.amibroker.com/f?StrFormat

In the above example the whole title definition is enclosed with _N() function. This just prevents from displaying the title string within the Interpretation window, so using _N() does not really affect the output within the chart.

How to manage overlapping entry/exit signals in portfolio test

When we run the portfolio-test and use default backtesting procedure – on each bar AmiBroker will first process exit signals, then use entry signals to open new trades.

There may be some strategies however, where this approach may not be enough. For example – if we simulate entries with limit price (so they occur somewhere in the middle of the day), but exits on Close – then if we do not use any margin loan, the funds from exit signals can only be used on subsequent days.

Since trading prices (BuyPrice, SellPrice, ShortPrice, CoverPrice arrays) don’t carry any timing information, but only the information about price level for given trade – then we need to delay release of funds by one day to get correct results. This can be done with the following command:

SetOption("SettlementDelay")

The unsettled cash is reported in the Detailed Log:

Detailed log

We need to remember that this option works on Days (not bars) and it may be better to use it with backtestRegularRaw instead of backtestRegular, otherwise some trades may not be entered because funds are not settled immediately – so we may need to be able to enter not on first but subsequent buy signals (all would really depend on the particular trading rules) – the behaviour of backtestRegular mode and processing raw signals is explained here: http://www.amibroker.com/guide/h_portfolio.html

How to re-import the same data without downloading them again

If we have already downloaded several years of historical data using AmiQuote and for any reason we need to re-import this data once again (e.g. into a new database) – there is a way to avoid re-downloading the whole history.

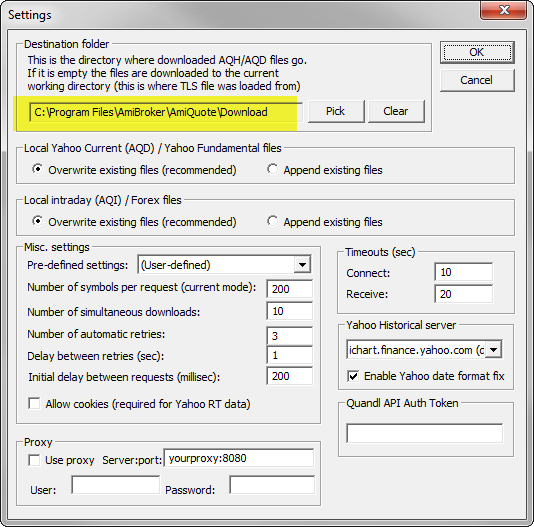
AmiQuote stores all downloaded data files inside of the dedicated destination folder. The exact location can be checked from AmiQuote: Tools->Settings menu:

AmiQuote settings

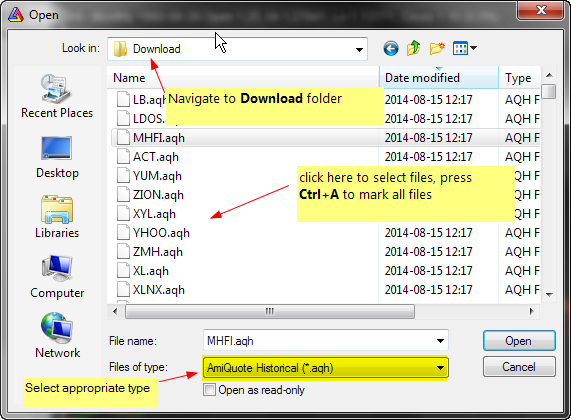
All recently downloaded files are stored in this folder and we can use ASCII importer in AmiBroker to pick these files manually for import. To do that please follow the steps below:

  1. Select File->Import ASCII
  2. In the open file dialog navigate to Download folder
  3. From Files of type field pick correct import definition to match the source used in AmiQuote:
    Import ASCII

  4. mark the .AQH files we want to import (to select all, it is enough to click on any of the files and hit CTRL+A, multiple file selection is also possible by clicking with CTRL or SHIFT keys pressed)
  5. press Open button to start import procedure

It is important to remember that by default each new download via AmiQuote overwrites the earlier files, so the AQH files will contain quotes from the very last download for given symbol.

More information about using ASCII importer can be found here:
http://www.amibroker.com/guide/h_amiquote.html
http://www.amibroker.com/guide/d_ascii.html

Checking relationship between multiple moving averages

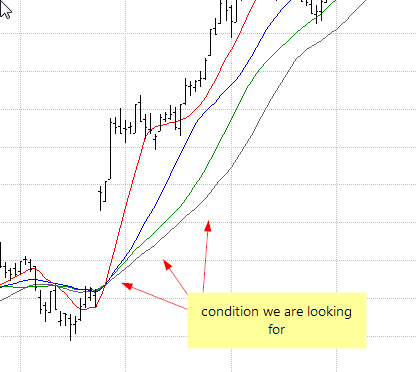
When we compare the positions of several lines against one another, we need to remember about using correct operators, so our AFL statement return correct results. Let us consider a set of moving averages using 10, 20, 30 and 40 periods, drawn with the following code:

MA10 MAClose10 );
MA20 MAClose20 );
MA30 MAClose30 );
MA40 MAClose40 );

PlotClose"Close"colorDefaultstyleBar );
PlotMA10"MA10"colorRed );
PlotMA20"MA10"colorBlue );
PlotMA30"MA10"colorGreen );
PlotMA40"MA10"colorgrey40 )

Multiple Moving averages

When we want to specify a condition where MA10 is highest of all of the lines, above MA20, which is above MA30 and with MA40 on the very bottom – we can NOT simply write:

condition MA10 MA20 MA30 MA40// WRONG - NOT what we really want, but no syntax erro

It may seem strange that such statement is accepted without an error but it is actually syntactically correct. This is because of the fact that True and False are represented by numbers 1 and 0 respectively, so all comparisons actually have numerical value that allows such statement to be evaluated and yield numeric result. The above statement is evaluated from left to right and would be an equivalent of:

condition = ( ( MA10 MA20 ) > MA30 ) > MA40// again WRON

Using > operator will return an array of True or False values (1 or 0). Therefore – the result of MA10 > MA20 comparison (which is True, that is equal to 1) would be then compared to MA30, resulting in checking 1 > MA30, then if such condition returns False (i.e. 0 ), we would end up with 0 > MA40 comparison that would return False (0) as the final output. This is of course not what we want to get.

That is why we should use AND operator instead, because we want to check several conditions being met at the same time, that is:

MA10 is above MA20
AND // must use AND/OR to combine multiple conditions
MA20 is above MA30
AND // must use AND/OR to combine multiple conditions
MA30 is above MA40

Therefore, we should write the AFL statement the following way:

condition MA10 MA20 AND MA20 MA30 AND MA30 MA40// correct way of checking multiple condition

So as a general guideline – if you have multiple boolean (yes/no) conditions that you want to combine into single rule, you need to use AND operator between conditions if you want True result when all conditions are met at the same time.

In a similar way, if you want a True result when any one (or more) of multiple conditions is met, then you need to use OR operator.

condition MA10 MA20 OR MA20 MA30// this will give True result if any one condition (or both) is me

How to show date axis in a newly created chart pane

When we double-click on the selected indicator in Charts window to display it in a new chart pane or apply our custom code as indicator, by default most of the indicator formulas will not show the date-axis, unless we specified such requirement in our formula.

In order to display the date axis, we need to click on the chart with the right mouse button, choose Parameters->Axes&Grid tab, then set Show date axis option to YES.

Axis&Grid

There is also a way to pre-code such condition in our custom indicator formula. To enable data-axis display when we apply the new indicator formula, we just need to add relevant SetChartOptions() function call:

SetChartOptions0chartShowDates );

// sample custom indicator
PlotRSI(), "RSI"colorRed )

More information about SetChartOptions function can be found in the AFL reference:
http://www.amibroker.com/f?SetChartOptions

Using IB controller (auto-trading interface) with 64-bit version of AmiBroker

AmiBroker allows to automate orders execution through Interactive Brokers account. In order to use the auto-trading capabilities it is necessary to install special component that communicates with IB TWS – the interface installer and documentation is available at:

http://www.amibroker.com/at/

By default the IB controller is installed to 32-bit release installation folder. So – that is the following location in 64-bit Windows system:

C:\Program Files (x86)\AmiBroker

If we are using 64-bit version, then it is necessary need to manually copy BrokerIB.exe and BrokerIB.xml files to the installation folder of 64-bit version, by default that is:

C:\Program Files\AmiBroker
« Previous PageNext Page »