amibroker

HomeKnowledge Base

How to run certain piece of code only once

There are situations where we may need to run certain code components just once, e.g. to initialize some static variables before auto-trading execution or perform some tasks (such as ranking) at the very beginning of backtest or exploration. The following techniques may be useful in such cases:

When we want to execute certain part of code just once after starting AmiBroker, we may use a flag written to a static variable that would indicate if our initialization has been triggered or not.

if( NzStaticVarGet("InitializationDone") ) == )
{
   
StaticVarSet("InitializationDone"1);
   
// code for first execution

If we want to run certain part of code at the beginning of the test run in Analysis window, we can use:

if ( Status("stocknum") == )
{
   
// our code here

When Status(“stocknum”) is detected in the code, then execution is performed in a single thread for the very first symbol. Only after processing of this first symbol has finished the other threads will start.

A practical example showing use of this feature is presented in the following tutorial:

http://www.amibroker.com/guide/h_ranking.html

How to browse charts in selected date range

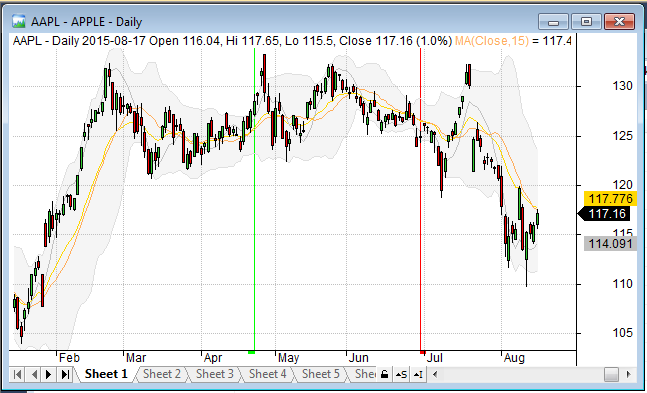
In order to select certain range of dates in the historical chart, then scroll through the history of tickers, we can mark the range of dates we interested in using Range Markers (double-click on the chart or mark the bars and hit F12, SHIFT+F12).

Range markers

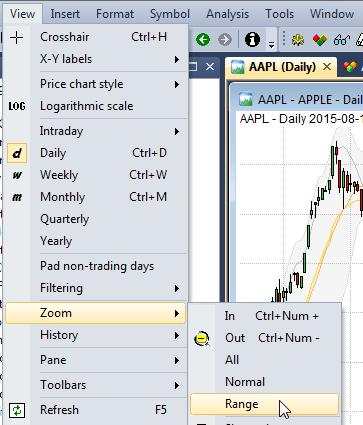
Then, use View->Zoom->Range menu to zoom the chart to our range selection.

Zoom to range

We can also assign a keyboard shortcut to View->Zoom->Range command or create a custom toolbar button to have it easily accessible (e.g. CTRL+SHIFT+R). This can be done in Tools->Customize (http://www.amibroker.com/guide/h_customizeui.html)

After we switch the symbol, in situations when the chart shifts e.g. due to different history length in those symbols – all we have to do is to hit CTRL+SHIFT+R to bring back the view to the range we wanted.

Browsing through the list of symbols can be automated further with scripts. Below is a sample auto-play script that will automatically browse through the list of symbols and will set the zoom to the dates we set in the code. All we need is just to start the script and watch it all switching automatically, without any manual actions required.

Here is a sample script that will browse through the list of symbols and set the zoom to show year 2010:

iWatchList 0/* you can define watch list number here */

AB = new ActiveXObject"Broker.Application" );
Qty AB.Stocks.Count;

for ( 
0Qtyi++ )
{
    
Stk AB.Stocks);

    if ( 
iWatchList 32 )
    {
        if ( 
Stk.WatchListBits & ( << iWatchList ) )
        {
            
AB.ActiveDocument.Name Stk.Ticker;
            
AW AB.ActiveWindow;
            
AW.ZoomToRange"2010-01-01""2011-01-01" );
            
WScript.Sleep2000 ); // 2 seconds delay
        
}
    }
    else
    {
        if ( 
Stk.WatchListBits2 & ( << ( iWatchList 32 ) ) )
        {
            
AB.ActiveDocument.Name Stk.Ticker;
            
AW AB.ActiveWindow;
            
AW.ZoomToRange"2010-01-01""2011-01-01" );
            
WScript.Sleep2000 ); // 2 seconds delay
        
}
    }

To use above code follow these steps:

  1. Open Notepad
  2. Copy-paste above the code
  3. Save the file with .JS extension (which means that system will treat this as JScript code)
  4. Make sure that AmiBroker is running with desired chart as active one
  5. Double click on .JS file to execute the JScript code

IMPORTANT: if you are running 64-bit Windows and have BOTH 32-bit and 64-bit versions of AmiBroker installed the OLE scripts by default would only talk to 64-bit instance. To use 32-bit version instead you would need to follow advice given in this article: http://www.amibroker.com/kb/2015/01/12/ole-automation-scripts-with-32-and-64-bit/

It is worth noting that going through series of charts is not the only way to compare performance of various symbols over time. There are other dedicated built tools for comparing several securities (without switching symbols, but within one chart window), including Price (Foreign) and Relative Performance indicator. These functionalities are shown in the following video:
http://www.amibroker.com/video/TwoSymbolsOneChart.html

How to restore program menus and/or toolbars

If we unintentionally make some changes to our toolbars or main menu using customization option, there is an easy way to restore the toolbars and menus to the default settings.

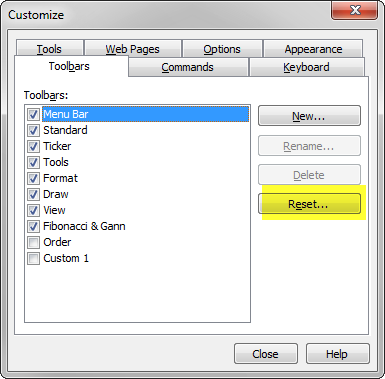
All we have to do is to select Tools->Customize menu, then in the Toolbars tab of the Customize dialog, click on the item we want to restore and press Reset button.

Reset toolbar

If any toolbar is missing, please verify if it has a checkmark switched on in the list shown above.

If all of this does not help and the toolbar and/or menu are still missing, then we can reset the position of all toolbars by using REGEDIT tool and removing all entries responsible for toolbar positions. The procedure is the following:

  1. exit AmiBroker
  2. use REGEDIT tool to edit the system registry (Windows Start->Run / type in: regedit )
  3. delete all entries starting with:
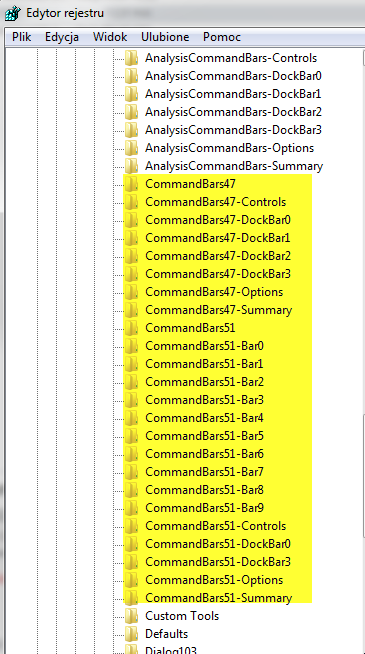
    HKEY_CURRENT_USER\Software\TJP\Broker\CommandBars
    

    as presented in the picture below

Reset toolbar

How to move a window to another monitor

By default document windows like Charts, Analysis, Account Manager, Web Research all open inside of main AmiBroker frame window. In multi-monitor setups it may be useful however to move some of them to another screen.

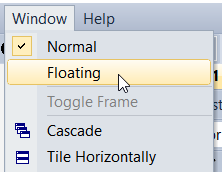
Let us say we want to move Analysis window to second monitor screen. This can be done by switching the window to special “Floating” mode by using Window->Floating option from the menu after opening Analysis.

Window menu

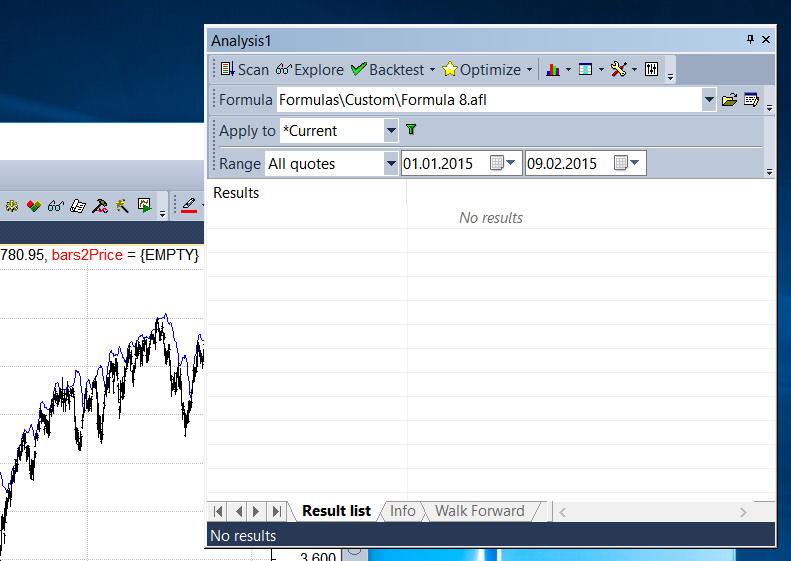
Using floating mode detaches Analysis from the main frame and then the window can be moved outside of it.

Window menu

Exactly the same procedure works for Chart windows, Account Manager or Web Research windows.

The procedure (for chart window) has also been shown in this video:
http://www.amibroker.com/video/FloatAndLink.html

How to categorize symbols coming from Metastock databases

Many data vendors that deliver data in MetaStock database format offer quotes in separate MS databases organized in several folders, separate for different markets or industries.

AmiBroker does not have any symbol limits, there is no need to maintain separate databases in AB and all the quotes can be placed in a single database. The configuration process of Metastock database as external data source is described here: http://www.amibroker.com/guide/h_extsources.html

AmiBroker supports internally many ways to categorise symbols into groups, markets, sectors, industries, etc. To learn more about categories available in AmiBroker please check this: http://www.amibroker.com/guide/h_categories.html

Now we may want to bring MS folder structure into AmiBroker’s category system. Sometimes data vendor would prepare appropriate automation scripts to do that work for us, but when they are not available, we can arrange the categories ourselves in the initial setup process.

To do so, we could pick the folders one-by-one, then reassign the symbols to desired categories. The process is the following:

First we configure the database:

  • Select File->New->Database menu
  • Enter the folder name and press Create
  • Choose MetaStock plugin as the datasource
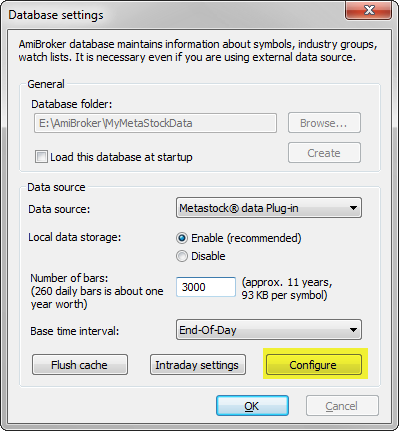
  • Press Configure

MS plugin config

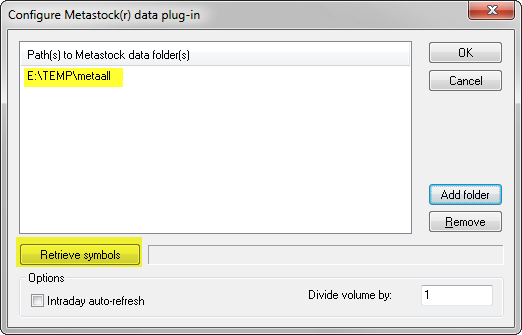
Now we pick single MetaStock folder (AmiBroker allows to import them all at once, however we want to avoid mixing the symbols from various folders) and press Retrieve button.

MS plugin config

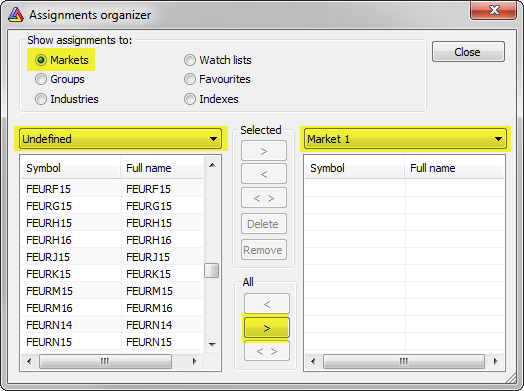
After pressing Retrieve we can close the database configuration dialog (OK, then OK again), go to Symbol->Organize Assignments and reassign the newly imported symbols from Undefined market or Industry into our desired location.

MS plugin config

Now we can return to File->Database Settings->Configure, retrieve another folder and repeat the assignment for that folder and so on and so on.

It is important to mention that this is just one-time procedure. After it is done, AmiBroker will automatically read all updates directly from MetaStock files.

There are also data-vendors offering data in MS format (such as PremiumData for example) that deliver ready-to-use configuration scripts – in such case it would allow to avoid such manual setup procedure and synchronize all category assignments automatically.

Positioning area plots behind the grid lines

When we want to paint the background with custom colors to indicate certain states or conditions – we can use area plots style for this purpose. The code example presented below shows green background when Close stays above 50-period moving average and red when below MA-50.

PlotClose"Close"colorDefaultstyleThick);
PlotMA50 MA(Close,50), "MA50"colorBluestyleThick);

color IIfClose MA50colorGreencolorRed );
Plot1""colorstyleArea|styleOwnScale,0,)

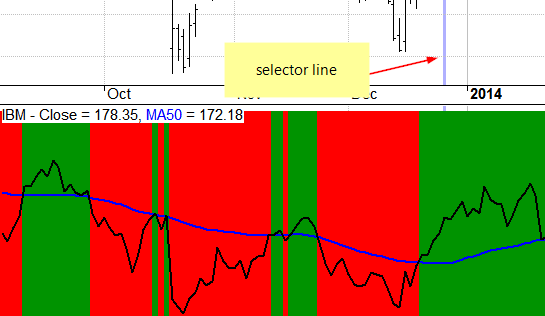
However – by default both grid lines and the selector line would get covered by the area plot:

area chart

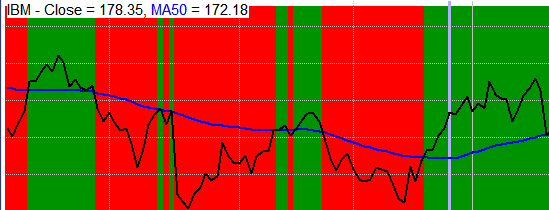
There is an easy fix for that – AmiBroker allows to specify the Z-axis position too, so we can shift the visibility and order of plots (including their position against grids and other elements) by means of Z-order argument of Plot function.

If we specify the Z-order argument to -1 that means we move the particular plot one level behind and this would also be located below the grids.

PlotClose"Close"colorDefaultstyleThick);
PlotMA50 MA(Close,50), "MA50"colorBluestyleThick);

color IIfClose MA50colorGreencolorRed );
Plot1""colorstyleArea|styleOwnScale,0,1,0,-); // the 8th argument specifies z-orde

fixed z-order area chart

More information about use of Z-order can be found in the User’s Guide:
http://www.amibroker.com/guide/h_indbuilder2.html

“Invalid symbol” message for stocks traded on multiple exchanges (IB)

Some of the symbols available from Interactive Brokers data-feed may be traded on multiple exchanges. In such case, when we enter the symbol to the database as:

INTC
GLD
CSCO

then we may see “Invalid symbol” message displayed by the Interactive Brokers plugin, as symbol SMART-STK-USD default format is not enough to uniquely identify the symbol. Therefore we would need to specify the primary exchange for the given symbol.

The primary exchange can be specified in the symbol using -!EXCHANGE suffix, so we can write the symbol like this

INTC-!NASDAQ

and it will instruct Interactive Brokers plugin to send NASDAQ as Primary Exchange for INTC to TWS.

We can however maintain similar ticker naming for all symbols in our database and use short names for all US symbols. To make it possible there is special dictionary (or translation table) for IB symbols that both plugin and IB automated trading interface use. In AmiBroker main folder there is a IBDictionary.txt file, which we can edit with any plain text editor (like Notepad) and provide symbol translations. It describes how symbols are translated before plugin communicates with TWS API.

The format of this file is CSV (comma separated values):

InputSymbol,OutputSymbol, comment (optional)

For example:

INTC,INTC-!NASDAQ, This is because INTC is now traded on multiple exchanges, so we need to set primary exchange
CSCO,CSCO-!NASDAQ, The same as above 
MSFT,MSFT-!NASDAQ
GLD,GLD-!ARCA

Symbol selection when PositionScore is not defined

AmiBroker’s portfolio backtester allows to define stock ranking and selection criteria by means of PositionScore variable. This is explained in details in the following tutorial chapter:

http://www.amibroker.com/guide/h_portfolio.html

If PositionScore is not defined or it has the same value for two or more symbols, then AmiBroker will use the following rules:

  1. transaction with greater PositionSize is preferred – the comparison method depends on the position sizing approach used in our code:
    • If we use SetPositionSize( dollarvalue, spsValue) – then $ value is compared.
    • If we use SetPositionSize( shares, spsShares) – then number of shares is used for comparison.
    • If we use SetPositionSize( perc, spsPercentOfEquity) – then % equity matters.
  2. alphabetical order
  3. long trades rather than short trades, if both occur at the same time for the same symbol.

How to handle delisted symbols in rotational test

This Knowledge Base article: http://www.amibroker.com/kb/2014/09/26/closing-trades-in-delisted-symbols/ explains how to close trades in delisted symbols in regular backtest (to avoid holding delisted stocks in the trade list and have our max symbol limit impacted by those positions).

In rotational test however we cannot use Sell variable, because trades are driven by symbols’ ranking by PositionScore values. Therefore we would need to assign zero to PositionScore variable for the exit bars respectively – this will force exiting any positions held in given stock.

EnableRotationalTrading();

bi BarIndex();
lastbi LastValuebi ) - Status("BuyDelay");
exitLastBar bi == lastbi;

score /*our regular positionScore*/;
PositionScore IIfexitLastBar 0score )

Note that we are adjusting the last bar index in case trade delays are set in the settings.

As in the regular test, we can also use DelistingDate information if we have it imported into Symbol ->Information window.

EnableRotationalTrading();
exitLastBar datetime() >= GetFnData("DelistingDate");

score /*our regular positionScore*/;
PositionScore IIfexitLastBar 0score )

Limit number of trades per day in a backtest

NOTE: The codes presented below are for intraday data only.

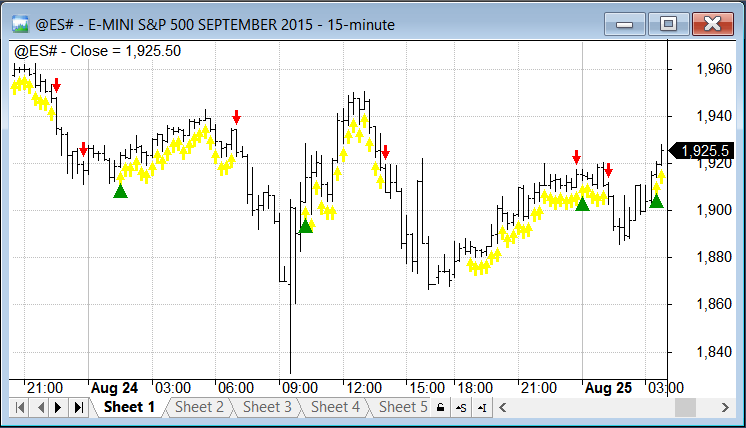
The scenario is as follows: we are intraday traders and we want to limit the number of trades made per day per symbol.

To simulate such scenario in a backtest, we need to count the signals and remove them accordingly after we reach our limit. There are several methods to do so and the choice depends on the signals that our system generates.

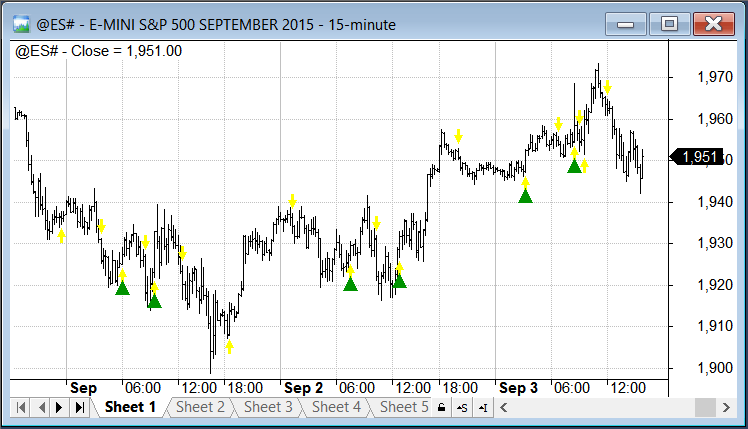
If our trading signals come in a sequence like Buy-Sell-Buy-Sell (without repeated signals in between), then we could just count BUY signals since the beginning of the day and allow first N of these signals, where N is the number of trades we allow. This can be achieved with Sum function:

// trades limit
2;

PlotClose"Close"colorDefaultstyleBar );

// identify new day
dn DateNum();
newDay dn != Refdn,-1);

// buy and sell signals
Buy CrossMACD(), Signal() );
Sell CrossSignal(), MACD() );

// visualize signals with yellow arrows
PlotShapes(Buy*shapeUpArrowcolorYellow0Low);
PlotShapes(Sell*shapeDownArrowcolorYellow0High);

// modify Buy array and allow only first N signals
Buy Buy AND SumBuyBarsSincenewDay) +) <= N;

// visualize modified signals with green triangles
PlotShapes(Buy*shapeUpTrianglecolorGreen0Low, -24)

Price chart

If the signals of the same type may get repeated and occur for example in sequence like Buy-Buy-Buy-Sell, then before counting the entry signals we would first need to remove redundant ones. This can be achieved with Equity( 1 ) function call, which will remove repeated signals the way backtester would handle them:

// trades limit
2;

PlotClose"Close"colorDefaultstyleBar );

// identify new day
dn DateNum();
newDay dn != Refdn, -);

// buy and sell signals
Buy =  MACD() > Signal(); // sample repeated signals
// exit on signal vs macd crossover or last bar of the day
Sell CrossSignal(), MACD() ) OR Refnewday); 

// visualize signals with yellow arrows
PlotShapesBuy*shapeUpArrowcolorYellow0Low );
PlotShapesSell*shapeDownArrowcolorred0High );

// remove redundant signals
Equity);

// modify Buy array and allow only first N signals
Buy Buy AND SumBuyBarsSincenewDay ) + ) <= N;

// visualize modified signals with green triangles
PlotShapesBuy*shapeUpTrianglecolorGreen0Low, -24 )

Price chart

When our trading system uses complex trading rules so we don’t know the order of signals, we can use a loop to process signals and count trades.

// trades limit
2;

PlotClose"Close"colorDefaultstyleBar );

// identify new day
dn DateNum();
newDay dn != Refdn, -);

// buy and sell signals
// sample repeated signals
Buy =  MACD() > Signal();
//exit on signal vs macd crossover or last bar of the day
Sell CrossSignal(), MACD() ) OR Refnewday); 

// visualize signals with yellow arrows
PlotShapesBuy*shapeUpArrowcolorYellow0Low );
PlotShapesSell*shapeDownArrowcolorred0High );

tradeCount onBuy 0;

for( 
0BarCounti++ )
{
    
// reset trade counter on the new day
    
if( newDay] ) tradeCount 0;

    
// keep buy signal if there is no trade and trade count did not hit the limit
    
if( Buy] AND tradeCount AND NOT onBuy )
    {
        
OnBuy 1;
        
TradeCount++;
    }
    else
        
Buy] = 0// ignore other buy signals


if( onBuy AND Sell] )
    {
        
onBuy 0// reset onBuy flag on exit
    
}
}

// visualize modified signals with green triangles
PlotShapesBuy*shapeUpTrianglecolorGreen0Low, -24 )
« Previous PageNext Page »