amibroker

HomeKnowledge Base

How to fill background between hand-drawn trend lines

Among built-in drawing tools, the Triangle, Rectangle and Ellipse allow to fill the background with custom color. However, if we wanted to fill the space between manually drawn trend lines, then we could use AFL formula with Study function that allows to detect the position of the line. Then – knowing the arrays of top and bottom lines we could fill the area between with a cloud plot.

A sample formula, which shows such implementation is presented below. The code fills the space between L1 and L2 trendlines (red color) and between upper and lower bands of the regression channel (RU and RL study id’s respectively).

// regular price plot
PlotClose"Close"colorDefaultstyleBar );

// custom function definition
function FillSpaceID1ID2color )
{
   
// get current chart ID
   
chartID GetChartID();

   
// read the positions of the lines
   
l1 Study(ID1chartID );
   
l2 Study(ID2chartID );

   
// draw cloud chart
   
PlotOHLCl1l1l2l2""ColorBlend(colorGetChartBkColor() ), styleCloud|styleNoRescale|styleNoLabelNullNull0, -);
}

// call function and refer to the assigned study ID's
FillSpace"L1","L2"colorRed );
FillSpace"RU","RL"colorBlue )

The chart produced by the formula looks as follows:
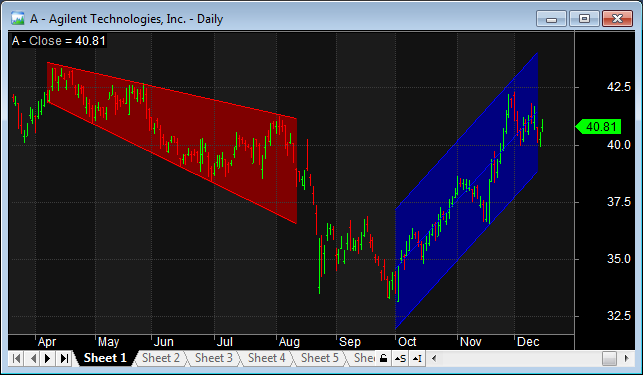
Chart with background fill

We need to remember that each line needs to have unique Study ID assigned in the Properties window.
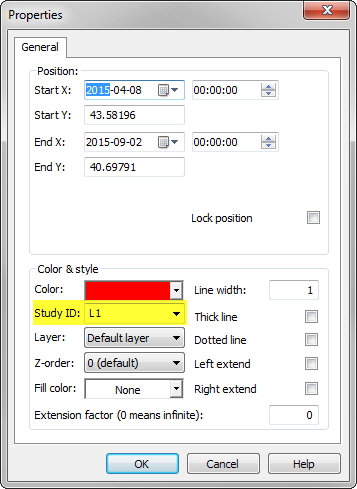
Properties window

In case of regression channel the ID’s of the upper and lower lines are defined in Regression Channel tab:
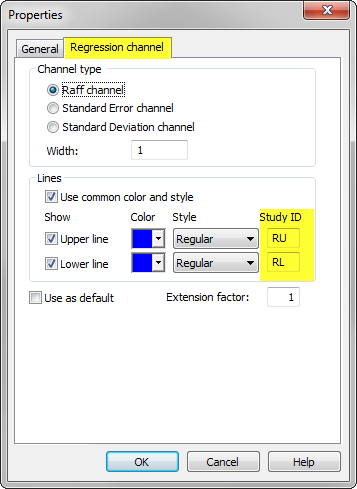
Properties window

If we wanted to handle more lines, then it may be more practical to process the list of study ID’s defined in a custom string instead of individual function calls.

// regular price plot
PlotClose"Close"colorDefaultstyleBar );

// custom function definition
function FillSpaceID1ID2color )
{
   
// get current chart ID
   
chartID GetChartID();

   
// read the positions of the lines
   
l1 Study(ID1chartID );
   
l2 Study(ID2chartID );

   
// draw cloud chart
   
PlotOHLCl1l1l2l2""ColorBlend(colorGetChartBkColor() ), styleCloud|styleNoRescale|styleNoLabelNullNull0, -);
}

function 
BulkFillIDlistcolor )
{
    for( 
0; ( ID1 StrExtractIDlist) ) != ""+= )
    {
      
ID2 StrExtractIDlisti+);
      
FillSpaceID1,ID2color );
    }
}

// call function and refer to the assigned study ID's
BulkFill"L1,L2,RU,RL,R1,R2"colorRed )

How to combine multiple databases into one

In order to combine data stored in two separate databases within a single database we may consider one of the following options:

ASCII IMPORT/EXPORT METHOD

First of the possible ways is to export data from one database into CSV files using the procedure presented here:

http://www.amibroker.com/kb/2006/03/04/how-to-export-quotations-from-amibroker-to-csv-file/

Once we have our quotations exported into text files, we can load the other database and use built in ASCII importer to import data. The detailed procedure is outlined in the following Knowledge Base Article:

http://www.amibroker.com/kb/2014/12/29/importing-data-using-multiple-column-separators/

FILE COPY METHOD

Another way of combining the databases is to copy the individual symbols files. Each database stores individual data files within 0-9,a-z,”_” subfolders and it is possible to copy the individual data files between databases. When copying, we need to maintain the same folder pattern and copy symbols from “a” subfolder of one database into “a” subfolder of the other database (the same for other folders), so each of the symbols would land in its respective folder.

After we copy the data files, we also need to delete broker.master file from the target database folder. This is because this file stores pre-generated symbol list used for fast loading. When we delete the file, it will be reconstructed based on information from individual data files.

More information about the database structure can be found in the manual:
http://www.amibroker.com/guide/h_workspace.html

Number of stopped-out trades as a custom metric

For the purpose of counting trades closed by particular stop we can refer to ExitReason property of the trade object in the custom backtester. The custom backtest formula presented below iterates through the list of closed trades, then counts the trades, which indicate exit reason = 2, that is stop-loss.

The following values are used for indication of the particular exit reason:

  1. normal exit
  2. maximum loss stop
  3. profit target stop
  4. trailing stop
  5. n-bar stop
  6. ruin stop (losing 99.96% of entry value)
SetCustomBacktestProc"" );

/* Now custom-backtest procedure follows */
if( Status"action" ) == actionPortfolio )
{
    
bo GetBacktesterObject();

    
bo.Backtest(); // run default backtest procedure

    // initialize counter
    
stoplossCountLong stoplossCountShort 0;

    
// iterate through closed trades
    
for( trade bo.GetFirstTrade(); tradetrade bo.GetNextTrade() )
    {

      
// check for stop-loss exit reason
        
if( trade.ExitReason == )
        {
         
// increase long or short counter respectively
            
if( trade.IsLong() )
                
stoplossCountLong++;
            else
                
stoplossCountShort++;
        }
    }

   
// add the custom metric
    
bo.AddCustomMetric"Stoploss trades"stoplossCountLong stoplossCountShort,
                         
stoplossCountLongstoplossCountShort);

}

Buy CrossMACD(), Signal() );
Sell CrossSignal(), MACD() );
Short Sell;
Cover Buy;
ApplyStopstopTypeLossstopModePercent2)

How to hide unused categories

AmiBroker categories offer 256 Markets, 256 Groups, 256 industries grouped within 64 sectors, plus unlimited number of watchlist (and support for other categorization standards such as ICB and GICS).

By default all markets, groups, sectors and industries are displayed, even if no symbol is assigned to them (so they are “empty”).

Hide categories

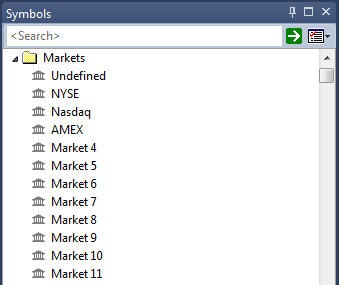
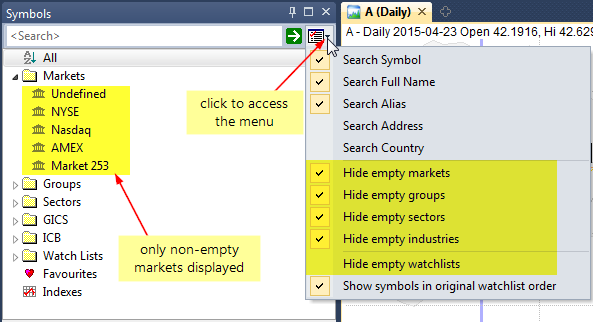
To avoid showing all the categories in Symbols window tree, we can use one of Hide empty markets/groups/sectors/industries/watchlists options available in the menu in Symbols window:

Hide categories

Now the list of categories shows only those, which contain at least one symbol and empty ones are omitted. More information about categories in AmiBroker can be found in the following chapter of the User’s Guide: http://www.amibroker.com/guide/h_categories.html

How to fix Error 61 in printf/StrFormat calls

AmiBroker version 6.07 has introduced a strict check for correct string formatting in printf and StrFormat functions. These functions allow to specify the string followed by the list of arguments that will be inserted into the string in places, where %f, %g or %e specifiers are entered.

This works the following way:

StrFormat example

It is important for the list of subsequent arguments to match the number of % specifiers in the string. In cases, where there is no match – AmiBroker will display Error 61 message. Strict check is required because Microsoft C runtime crashes if wrong parameters are passed. Passing on earlier version was dangerous because it would lead to random crashes now and then depending on machine configuration.

There may be the following typical problems in the code:

Example 1. Four % specifiers, five value arguments

In this example formatting string contains four % specifiers so AmiBroker expects four arguments coming later, but five are given instead (too many).
// WRONG - too many value arguments
Title StrFormat"Open: %g, High: %g, Low: %g, Close: %g"OpenHighLowCloseVolume );

// CORRECT
Title StrFormat"Open: %g, High: %g, Low: %g, Close: %g"OpenHighLowClose )

Example 2. Five % specifiers, four value arguments

In this example formatting string contains five % specifiers so AmiBroker expects five arguments coming later, but four are given instead (too few).

// WRONG - %.0f specifier does not have a matching argument
Title StrFormat"Open: %g, High: %g, Low: %g, Close: %g, Volume: %.0f"OpenHighLowClose );

// CORRECT
Title StrFormat"Open: %g, High: %g, Low: %g, Close: %g, Volume: %.0f"OpenHighLowCloseVolume )

Example 3. Incorrectly coded percent (%) sign

In this example user wanted to print just % (percent sign), but used % (wrong) instead of %% (correct specifier of literal percent sign).

// WRONG - to show the % sign in the output we need to use %%
Title StrFormat"Close: %g (%.1f%)"CloseSelectedValueROCClose1) ) );

// CORRECT - you should use %% to print actual percent sign
Title StrFormat"Close: %g (%.1f%%)"CloseSelectedValueROCClose1) ) )

The example 3 requires special attention, as it is a common mistake. Due to the fact that % sign is a special character, we need to use %% in our string if we want to print % sign in the output string.

Adding custom grid levels to RSI indicator

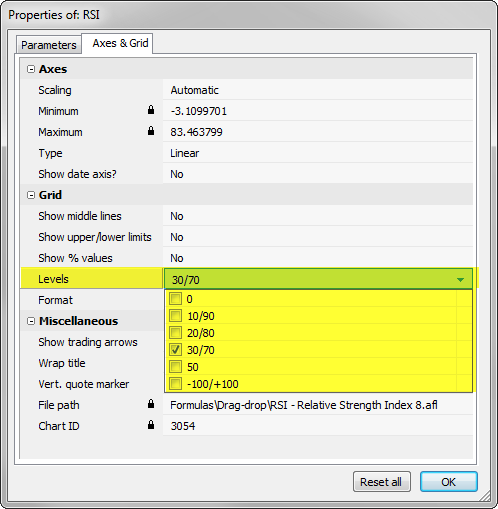
Built-in RSI indicator offers the ability to display one of predefined grid levels to indicate oversold and overbought regions. This can be done in Axes&Grid tab of Parameters window available under right-mouse button.

Grid settings

If we require more flexibility, then as an alternative, we could modify the code and call PlotGrid function to display the custom grid lines. This allows to specify any level for the grids. A modified formula is presented below:

SetChartOptions0chartShowArrows);
periods Param"Periods"151200);
oversold Param"Oversold level"151100);
overbought Param"Overbought level"851100);

PlotRSIperiods), _DEFAULT_NAME(), ParamColor"Color"colorCycle ), ParamStyle("Style")  );
PlotGridoversold );
PlotGridoverbought )

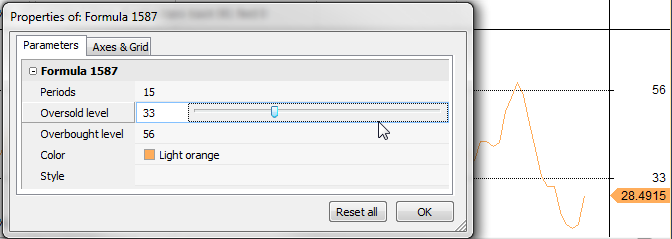
Param window settings

Now, since the formula uses Param function as input, the custom grid levels can be defined and modified in Parameters tab.

Automatic support and resistance lines based on last HHV and LLV value

In this example we will present a method to plot automatic support and resistance lines based on recently hit highs/lows. In order to draw horizontal lines showing levels of recent HHV/LLV values and start drawing at the point of the chart, which defines given price level – we first need to identify the bar, where the line should start. This can be done with use of HHVBars / LLVBars functions.

These functions allow to find out the number of bars that have passed since our support or resistance level was established, so we could prevent from drawing the lines before these points.

This example shows how to draw support and resistance lines based on HHV/LLV levels:

// define reusable function
function SupResLevelsbarscolorUpColorDn )
{
   
bi BarIndex();
   
lvbi LastValuebi );

   
// return HHV value only for bars starting from the bar where HHV level was established
   
hv IIfbi >= lvbi LastValueHHVBarsHighbars ) ), LastValueHHVHighbars ) ), Null );

   
// the same approach for LLV
   
lv IIfbi >= lvbi LastValueLLVBarsLowbars ) ), LastValueLLVLowbars ) ), Null );

   
// plot levels
   
Plothv"hv"colorUpstyleDashed );
   
Plotlv"lv"ColorDnstyleDashed );
}

// price plot
PlotClose"Close"colorDefaultstyleBar );

// call function with various parameters
SupResLevels10colorGreencolorRed );
SupResLevels50colorGreencolorRed )

The chart below shows the output produced by the formula:

Automatic resistance/support levels

How to fix outdated web research links

Built-in Web Research window allows to browse symbol-related websites based on the active symbol selected in AmiBroker, so navigation is much more convenient than searching for symbols in regular web-browser. The following tutorial chapter explains this functionality in details: http://www.amibroker.com/guide/h_webresearch.html

Since AmiBroker stores pre-defined link templates, there is a possibility that given website changes the structure of their addresses and that would also require us to modify the link templates in AmiBroker configuration to match new website structure.

When the Web research window shows error 404 or other message indicating that the address may not be correct, then we would need to perform the following actions (this example discusses changes at MarketWatch).

First we need to check for a sample symbol’s web page directly at given website to see what address is being used. Let us search for AAPL and MSFT symbols profile at MarketWatch. The addresses are the following:

http://www.marketwatch.com/investing/stock/msft/profile
http://www.marketwatch.com/investing/stock/aapl/profile

Therefore, if we want AmiBroker to place the selected ticker name in the link, then we need to define the following template:

http://www.marketwatch.com/investing/stock/{t}/profile

{t} item in the above address evaluates to the ticker symbol based on our selection in the program.

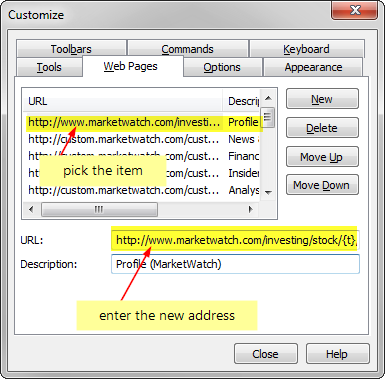
After that, we need to check what is the pre-defined template stored in Tools->Customize->Web Pages. If it is different than the link structure currently used at MarketWatch, then we need to update the stored address with the template shown above. The difference would mean that the website structure has changed since the link templates were added to AmiBroker configuration.

Customization dialog

Now the modified Profile page links match Marketwatch website and the company profile will work correctly in Web Research window.

How to execute part of the formula only when new bar is added

In realtime conditions we may be interested in executing some parts of our formula only once per bar, when a new bar is created (e.g. for auto-trading purposes or just for notification). To do that – we would need to identify the very moment when new bar appears.

This can be done using static variables to record the timestamp of the most recent bar, then comparing current reading with the recorded value. Once the difference is detected – we can conditionally run our code and update the recorded time info.

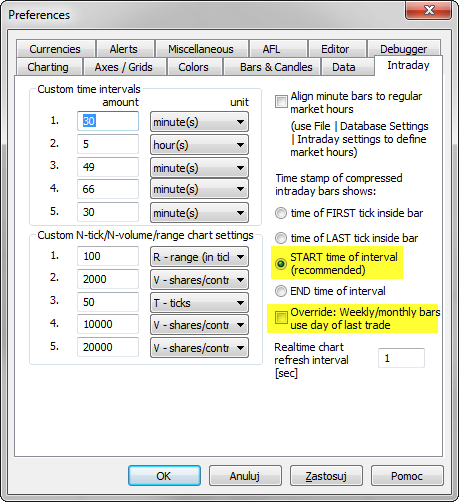
Such an approach will work if we use timestamps that don’t change with each tick, so preferred option is to use Start Time of Interval for timestamp display (for daily and higher intervals we should unmark “override” box):

Intraday Settings

Then we can use the following code (this sample formula will just play a ding.wav system sound when the new bar is detected):

// read last bar date/time
lastBartime LastValueDateTime() );

// we use per-symbol variable
// you may consider to add GetChartID() key if you want
// to use the formula in multiple charts shown at the same time
varName Name() + "_lastdt";

// read recorded date/time from last execution
recordedTimestamp NzStaticVarGetvarName ) );

// code runs conditionally only when new bar is detected
if( lastBarTime != recordedTimestamp )
{
    
// record new bar datetime
    
StaticVarSetvarNamelastBartime );

    
//////////////////////////////////////
    // main code here
    
PlaySound"c:\\windows\\media\\ding.wav" );
    
//////////////////////////////////////
}

// sample indicator code
PlotClose"Close"colorDefaultstyleBar )

Newer AmiBroker versions (>5.60) can use this for reading last bar timestamp (this is faster than using DateTime() function).
lastBartime Status("lastbarend")

How to increase maximum periods of built-in indicators

Built-in indicators and averages which are shipped with AmiBroker use Param() function calls to provide the ability to adjust parameter values through Parameters window. Param function in the code specifies default, minimum, maximum values for the input arguments.

The order of arguments in Param function is the following:

Param"name"defaultvalminmaxstepsincr 

In certain situations, we may however want to use larger period settings than the pre-defined maximum. There is an easy way to adjust the code to achieve such task. Let us consider using built-in Price (all in one) indicator and setting e.g. 200 or 300 periods for Bollinger Bands (default maximum is 100).

To modify the underlying code, we need to:

  1. Click on the chart with right mouse button and choose Edit Formula from the context menu to bring up the AFL code editor
  2. In the code identify Bollinger Band section and the Param function call responsible for setting number of periods and change it from 200 to 300 as shown in the picture below.

    Param call

  3. Approve the changes, by selecting Tools->Apply from the editor’s menu

Now we can go back to Parameters dialog and we will be able to set Bollinger Bands Periods setting up to 300 periods.

« Previous PageNext Page »