amibroker

HomeKnowledge Base

Indicators based on user values rather than standard OHLC prices

Sometimes we may want to calculate indicators based not only on standard OHLC prices but on some other user-definable values. Some functions like RSI or CSI have additional versions (RSIa, CCIa respectively) that accept custom input array. In this case it is very easy to calculate the indicator based on user defined value. For example RSI from average of High and Low prices could be written as follows:

customArray = ( High Low ) / 2;

PlotRSIacustomArray14 ), "RSI from (H+L)/2"colorRed )

But many of the built-in indicators available in AFL as functions refer indirectly to standard OHLC arrays and their parameters do not offer array argument as one of inputs.

Fortunatelly there is an easy way to provide custom array as input for any other built-in functions. For this purpose, it is enough to override OHLC arrays (or just Close if the indicator only uses Close as input) within the code before calling given function and assign our custom array. As a simple example, let us consider calculating MACD indicator out of average of High and Low prices as input.

procedure SaveRestorePricesDoSave )
{
  global 
SaveOSaveHSaveLSaveCSaveV;

  if( 
DoSave )
  {
     
SaveO Open;
     
SaveH High;
     
SaveL Low;
     
SaveC Close;
     
SaveV Volume;
  }
  else
  {
    
Open SaveO;
    
High SaveH;
    
Low SaveL;
    
Close SaveC;
    
Volume SaveV;
  }
}

// save OHLCV arrays
SaveRestorePricesTrue );

// calculate our array
customArray = ( High Low ) / 2;

// override built-in array(s)
Close customArray;

// calculate our function, MACD and Signal in this case
PlotMACD1226 ), "MACD"colorRed );
PlotSignal1226), "Signal"colorBlue );

// restore OHLCV arrays
SaveRestorePricesFalse )

The code first calculates the custom array (we use just use average of High and Low prices in this example, but of course the calculations may be more complex), then assigns the result of these calculations to Close overriding the regular values stored in close array. Then – when we call MACD() function which uses Close as input – it will be based on the modified values.

The above operations do not affect the underlying database at all – the prices are overridden only for the purpose of calculation of this particular formula and other charts / indicators are not affected at all.

Using per-symbol parameter values in charts

Parameter values in AmiBroker are stored separately for each ChartID. A ChartID is a number that uniquely identifies chart. This makes it possible that parameters having same name can hold different values when they are used in different charts (different ChartIDs). This also allows to share parameters if two panes use same ChartID. (A detailed explanation can be found here: http://www.amibroker.com/kb/2014/10/06/relationship-between-chart-panes/ )

For this reason, if we want to have separate chart parameters for each symbol, we need to set up separate chart for every symbol. To do so, follow these steps:

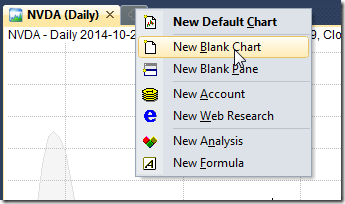
  1. create several new chart windows using File->New->Blank Chart (or choosing New Blank Chart from the menu under + button in MDI tabs area)
    New Blank Chart

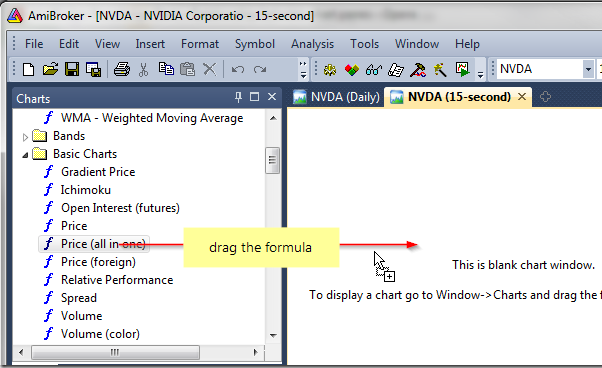
  2. drag Price( all in one) formula or any other indicators onto each of the newly opened windows
    Drag-drop chart

  3. select different active symbol for every chart
  4. define parameters individually and save the whole layout in the Layouts window

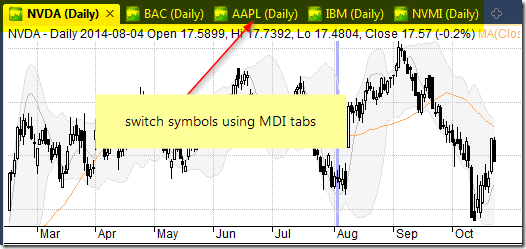
As a result – we have a setup of several chart windows, where we can quickly access given symbol showing chart with its separately stored parameters.

MDI Charts

There is also a way to handle the chart parameter values directly from the AFL formula, which would detect the active symbol and set the parameter values accordingly. Here is an example of such implementation using switch statement:
http://www.amibroker.com/guide/keyword/switch.html

To display this chart, open the Formula Editor, enter the following code and then press Apply Indicator button.

// detect the active symbol and store in n variable
Name();

// set parameter values based on the symbol name
switch ( )
{
// values for MSFT symbol
case "MSFT":
    
MA1periods 10;
    
MA2periods 21;
    break;

// values for IBM and NVDA
case "IBM":
case 
"NVDA":
    
MA1periods 30;
    
MA2periods 40;
    break;

// values for other tickers
default:
    
MA1periods 50;
    
MA2periods 100;
    break;
}

PlotClose"C"colorDefaultstyleBar );

PlotMACloseMA1periods ) , "MA(" MA1Periods ")" colorRed );
PlotMACloseMA2periods ) , "MA(" MA2Periods ")"colorBlue )

This way we can handle all individual parameter values within a single chart pane.

Time compression of data retrieved from another symbol

AmiBroker’s Time-Frame functions (http://www.amibroker.com/guide/h_timeframe.html) allow to use multiple intervals within a single formula and combine them together. Another set of functions in AFL (Foreign and SetForeign) allow us to retrieve data of another symbol from the database, so we can implement strategies where rules are based on multiple symbols.

This article shows how to combine these two features together and properly use Time-Frame functions on data retrieved from another symbol. Let us consider an example of a strategy, which works on daily data, but uses an additional filter based on weekly readings of S&P500 index.

The following sequence is required to code such conditions properly:

  1. switch to the other symbol with SetForeign
  2. compress data into higher interval with TimeFrameSet
  3. store the weekly values / conditions in custom variables
  4. with TimeFrameRestore() or RestorePriceArrays() functions restore the original arrays of the tested symbol (in the original time-frame)
  5. use custom variables assigned in step (3) expanded to original time-frame using TimeFrameExpand()

Here is the AFL formula, which implements the above conditions:

// first switch to ^GSPC symbol
SetForeign"^GSPC" );
//
// compress data to weekly interval
TimeFrameSetinWeekly );
//
// assign weekly values to custom variables
indexWeeklyClose Close;
indexWeeklyMA =  MAClose52 );
indexWeeklyFilter Close MAClose52 );
//
// restore original arrays (back to the primary symbol)
// RestorePriceArrays() function is an equivalent
TimeFrameRestore();
//
// align data back to original interval
indexFilterExpanded TimeFrameExpandindexWeeklyFilterinWeekly );
//
// exploration shows the results, note that all weekly values
// need to be expanded if we haven't done it yet
//
Filter 1;
AddColumnClose"Close AAPL" );
AddColumnTimeFrameExpandindexWeeklyCloseinWeekly ), "Weekly close ^GSPC" );
AddColumnTimeFrameExpandindexWeeklyMAinWeekly ), "Weekly MA ^GSPC" );
AddColumnindexFilterExpanded"Weekly index filter")

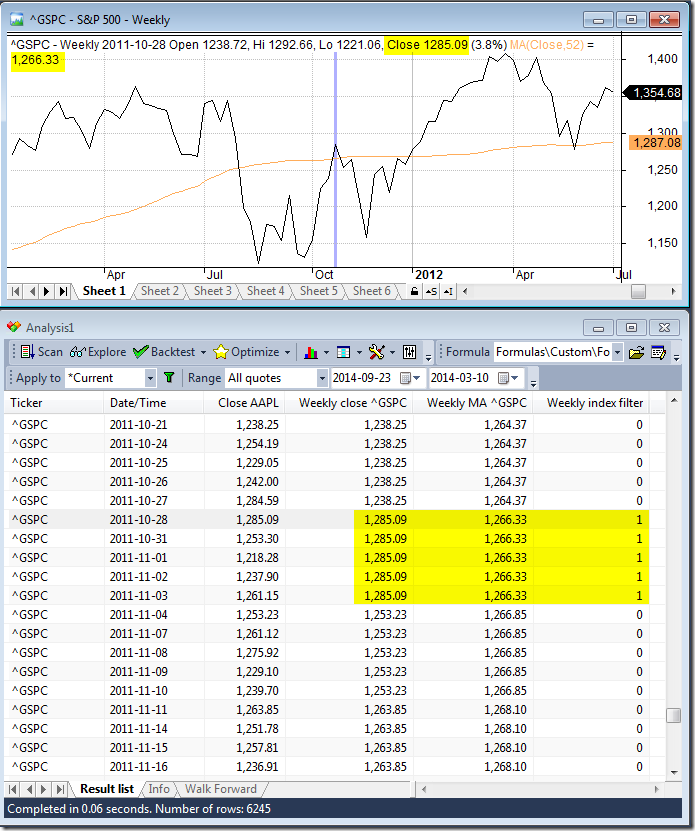
Let us compare the readings obtained from the code with a sample chart – both ^GSPC raw reading and 52-week MA values match the chart and the condition is properly aligned to the bars starting on 2011-10-28 and extends until new weekly bar is formed.

TimeFrame + Foreign

There is also an alternative method we can use:

  1. retrieve values from ^GSPC using Foreign() function
  2. compress these readings into weekly interval using TimeFrameCompress
  3. perform calculations on weekly compressed array
  4. expand the compressed data back to the original timeframe using timeFrameExpand
indexClose Foreign("^GSPC","C");
indexWeeklyClose2 TimeFrameCompressindexCloseinWeekly );
indexWeeklyMA2 MAindexWeeklyClose252 );
indexWeeklyFilter2 indexWeeklyClose2 indexWeeklyMA2;
//
Filter 1;
AddColumnClose"Close AAPL" );
AddColumnTimeFrameExpandindexWeeklyClose2inWeekly ), "Weekly close ^GSPC" );
AddColumnTimeFrameExpandindexWeeklyMA2inWeekly ), "Weekly MA ^GSPC" );
AddColumnTimeFrameExpandindexWeeklyFilter2inWeekly ), "Weekly index filter")

How to draw regression channel programatically

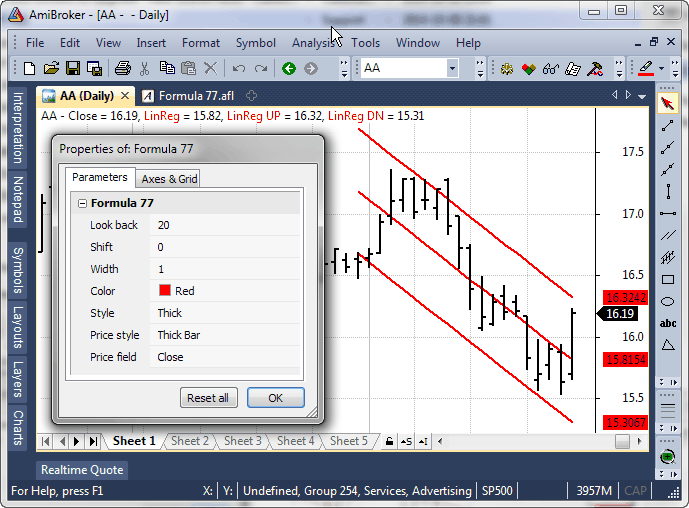
Built-in drawing tool allows to place regression channel on the chart manually and the study works on regular Close array as input. The power of AFL allows to automate this task and draw a customizable regression channel automatically in the chart or choose any custom array for calculation.

Here is a sample coding solution showing how to code Standard Deviation based channel. The Parameters dialog allows to control the array the channel is based upon, number of periods used for calculation, position and width of the channel.

lookback Param"Look back"201200);
shift Param"Shift"0020);
multiplier Param"Width"10.2550.25 );
color ParamColor"Color"colorRed );
style ParamStyle"Style"styleLine styleDots );
pricestyle ParamStyle"Price style"styleBar styleThickmaskPrice );
//
// price chart
PlotClose"Close"colorDefaultpricestyle );
//
array = ParamField"Price field", -);
//
BarIndex() + 1;
lastx LastValue) - shift;
//
// compute linear regression coefficients
aa LastValueRefLinRegIntercept( array, lookback ), -shift ) );
bb LastValueRefLinRegSlope( array, lookback ), -shift ) );
//
// the equation for straight line
Aa bb * ( - ( Lastx lookback ) );
//
width LastValueRefStDev( array, lookback ), -shift ) );
//
drawit > ( lastx lookback ) AND BarIndex() < Lastx;
//
// draw regression line...
PlotIIfdrawityNull ), "LinReg"colorstyle );
// ... and channel
PlotIIfdrawitwidth*multiplier Null ), "LinReg UP"colorstyle );
PlotIIfdrawitwidth*multiplier Null ), "LinReg DN"colorstyle )

Here is the picture that shows how it looks:

Regression in AFL

Study() function in logarithmic scale

IMPORTANT: This article applies ONLY to AmiBroker version 5.24 and earlier. Version 5.25 includes native support for log scale in Study() function and this workaround is no longer needed.

Some of you may have tried using Study() function in logarithmic scale charts and noticed that the output of Study() function becomes curved line (not straight) as soon as logarithmic scale is used.

Before giving you solution, I would like to state some obvious things:
A straight line in log scale is NOT straight line in linear scale and vice versa. Trendlines drawn in log scale do NOT cross at the same points (except beginning and ending) as same trendline drawn in linear scale. This is pretty much the same in all charting programs.

As for the Study() function – it always uses LINEAR equation y = a*x + b regardless of particular chart scale. So, Study() always produces straight line in the linear price domain, so “a” coefficient is constant and represents the slope in price terms (dollar per bar)

This is done so, because Automatic Analysis does not have a concept of “scale” (linear vs logarithmic), therefore if Study() function was dependent on given pane setting it would not produce the same result, if the same formula was used in automatic analysis.

If you want to have “straight” line in the logarithmic price domain you need to convert to log domain in the formula, as shown in the code below


function StudyInLogScaleStudyidChartid )
{
  if( 
Version() < 5.25 )
  {
   
SetBarsRequiredsbrAllsbrAll );

   
temp StudyStudyidChartid );

   
bi BarIndex();

   
beg LastValueValueWhenExRemtemp), bi ) ); 
   
end LastValueValueWhentempbi ) );

   
result Null;
 
   if( 
beg BarCount AND end BarCount )
   {
    
begval tempbeg ];
    
endval tempend ];
    
factor endval/begval;

    for( 
beg<= endi++ )
    {
      
result] = begval factor ^ ( ( beg )/( end beg ) ); 
    }
   }
  }
  else
  {
    
result StudyStudyidChartid );
  }

  return 
result;        
}

logscale ParamToggle("Log Scale""Off|On");

SetChartOptionsIIflogScale2), chartLogarithmic );

PlotC"Price"colorBlackstyleCandle );

if( 
logscale AND Version() <= 5.24 )
{
 
ss StudyInLogScale("RE"GetChartID() );
}
else
{
 
ss Study("RE"GetChartID() );
}

Plotss"Study"colorRed )

How to convert from bar-value to pixel co-ordinates

NOTE: This article describes old method of using bar/value coordinates. New code should use GfxSetCoordsMode which allows you to use bar/value without any extra calculations.

Sometimes when using low-level graphics functions it is needed to convert from bar number to pixel X co-ordinate and from price level to pixel Y co-ordinate. Converting between them needs knowing visible bar range, Y-axis value range and pixel dimensions of drawing area. Once these params are known it is just a matter of performing simple scale transformation. The code example below shows how to do that.

function GetVisibleBarCount()
{
 
lvb Status("lastvisiblebar");
 
fvb Status("firstvisiblebar"); 

 return 
MinLvb fvbBarCount fvb );


function 
GfxConvertBarToPixelXbar )
{
 
lvb Status("lastvisiblebar");
 
fvb Status("firstvisiblebar");
 
pxchartleft Status("pxchartleft");
 
pxchartwidth Status("pxchartwidth"); 

 return 
pxchartleft bar  pxchartwidth / ( Lvb fvb );


function 
GfxConvertValueToPixelYValue )
{
 
local MinyMaxypxchartbottompxchartheight

 
Miny Status("axisminy");
 
Maxy Status("axismaxy"); 

 
pxchartbottom Status("pxchartbottom");
 
pxchartheight Status("pxchartheight"); 

 return 
pxchartbottom floor0.5 + ( Value Miny ) * pxchartheight/ ( Maxy Miny ) );


Plot(C"Price"colorBlackstyleHistogram ); 

GfxSetOverlayMode(0);
GfxSelectSolidBrushcolorRed );
GfxSelectPencolorRed ); 

AllVisibleBars GetVisibleBarCount();
fvb Status("firstvisiblebar"); 

for( 
0AllVisibleBars i++ ) 

  
GfxConvertBarToPixelX); 
  
GfxConvertValueToPixelYCfvb ] ); 

  
GfxRectanglex-1y-12y+); 


RequestTimedRefresh(1); // ensure 1 sec refres

Note that when chart scale changes, it will usually require one extra refresh to get low-level graphics alignment to new scale. That’s why we added RequestTimedRefresh call at the end.

Big symbol text in the background

Recently I heard the suggestion to add a security symbol written in big letters in the chart background. Well, actually it is pretty simple to do using low-level gfx. Just add this code sniplet anywhere in your chart formula.

GfxSetOverlayMode(1);
GfxSelectFont("Tahoma"Status("pxheight")/);
GfxSetTextAlign);// center alignment
GfxSetTextColorColorRGB200200200 ) );
GfxSetBkMode(1); // transparent
GfxTextOutName(), Status("pxwidth")/2Status("pxheight")/12 )

UPDATE: I have added transparent mode, so it works fine on non-white backgrounds too.

How to detect the divergences

There are many different ways to check for divergences. One of the simplest is to use Rate of change indicator and EXPLORATION feature of Automatic Analysis window:

– Analysis -> Formula Editor
– enter:
 
// 5 day rate of change of close
PriceUp ROCC) > ;
// 5 day rate of change of MACD histogram
MacdUP ROCMACD() - Signal(), ) > 0;
BullishDiv NOT PriceUP AND MACDUp;
BearishDiv PriceUP AND NOT MACDUp;
Filter BullishDiv OR BearishDiv;
AddColumnBullishDiv"Bullish Divergence"1.0,
       
colorDefaultIIf(BullishDivcolorGreencolorDefault ) ); 
AddColumn
BearishDiv "Bearish Divergence"1.0,
       
colorDefaultIIf(BearishDiv colorRedcolorDefault) )

– Tools -> Send to Auto-analysis
– Apply to: All Symbols, N last quotations = 1
– press EXPLORE

Tools -> Send to Auto-analysis- Apply to: All Symbols, N last quotations = 1- press EXPLORE

A different approach can use linear regression instead:
 
// 10 day linear regression slope of close
PriceUp LinRegSlopeC10 ) > ;
// 10 day linear regression slope of MACD histogram
MacdUP LinRegSlopeMACD() - Signal(), 10 ); 


How to chart spreads?

To create a spread chart (and other multi-security indicators / statistics etc.) one can use FOREIGN function which allows to refer to other symbols than currently selected:

It’s necessary to do the following:
– Analysis -> Formula Editor
– enter the formula:


spread Foreign"ticker1""C") - Foreign"ticker2""C");
Plotspread"spread"colorRed); 

– Tools -> Apply Indicator
(replace ticker1, ticker2 with actual symbol names)

How to plot a trailing stop in the Price chart

In this short article we will show how to calculate and plot trailing stop using two different methods. (more…)

« Previous PageNext Page »