amibroker

HomeKnowledge Base

How to read highest high value of future bars

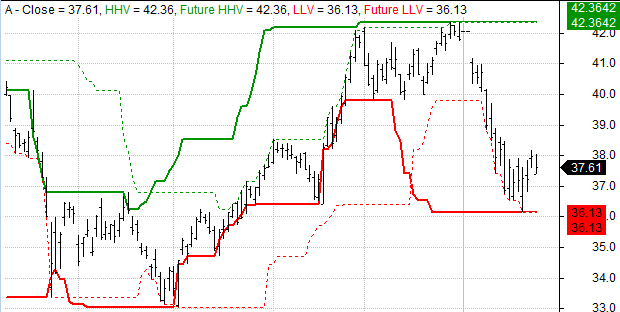
Built in HHV and LLV functions allow to read highest high or lowest low of n-past bars. If we want to refer to future values, there is an easy way to do it using simple Ref function and just shift HHV or LLV reading from N-bars ahead. A ready to use function showing such approach is presented below:

// function definitions
function futureHHV( array, periods )
{
   return 
RefHHV( array, periods ), periods );
}
function 
futureLLV( array, periods )
{
   return 
RefLLV( array, periods ), periods );
}

// sample use
PlotClose"Close"colorDefaultstyleBar );
PlotHHVH20 ), "HHV"colorGreenstyleDashed );
PlotfutureHHVH20 ), "Future HHV"colorGreenstyleThick );
PlotLLVL20 ), "LLV"colorRedstyleDashed );
PlotfutureLLVL20 ), "Future LLV"colorRedstyleThick )

And here is the chart produced by the formula above:
Future HHV

Adding custom grid levels to RSI indicator

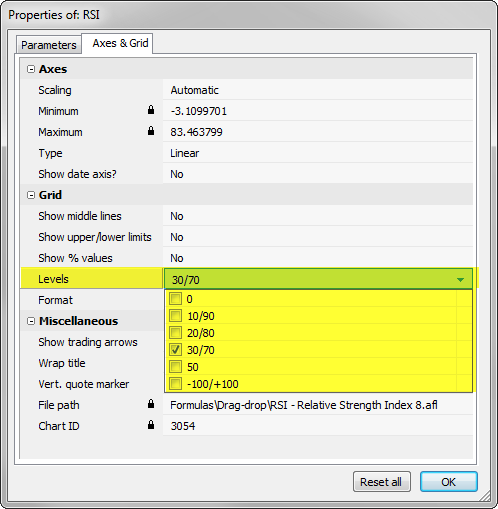
Built-in RSI indicator offers the ability to display one of predefined grid levels to indicate oversold and overbought regions. This can be done in Axes&Grid tab of Parameters window available under right-mouse button.

Grid settings

If we require more flexibility, then as an alternative, we could modify the code and call PlotGrid function to display the custom grid lines. This allows to specify any level for the grids. A modified formula is presented below:

SetChartOptions0chartShowArrows);
periods Param"Periods"151200);
oversold Param"Oversold level"151100);
overbought Param"Overbought level"851100);

PlotRSIperiods), _DEFAULT_NAME(), ParamColor"Color"colorCycle ), ParamStyle("Style")  );
PlotGridoversold );
PlotGridoverbought )

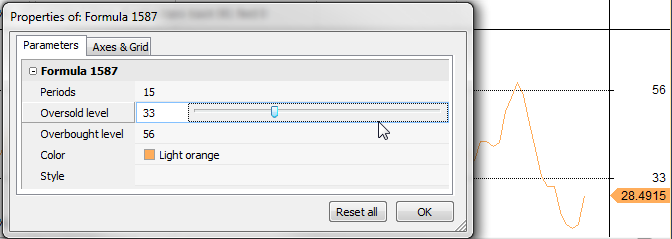
Param window settings

Now, since the formula uses Param function as input, the custom grid levels can be defined and modified in Parameters tab.

How to execute part of the formula only when new bar is added

In realtime conditions we may be interested in executing some parts of our formula only once per bar, when a new bar is created (e.g. for auto-trading purposes or just for notification). To do that – we would need to identify the very moment when new bar appears.

This can be done using static variables to record the timestamp of the most recent bar, then comparing current reading with the recorded value. Once the difference is detected – we can conditionally run our code and update the recorded time info.

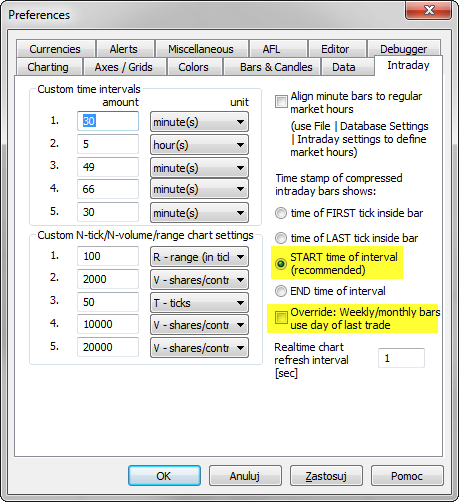
Such an approach will work if we use timestamps that don’t change with each tick, so preferred option is to use Start Time of Interval for timestamp display (for daily and higher intervals we should unmark “override” box):

Intraday Settings

Then we can use the following code (this sample formula will just play a ding.wav system sound when the new bar is detected):

// read last bar date/time
lastBartime LastValueDateTime() );

// we use per-symbol variable
// you may consider to add GetChartID() key if you want
// to use the formula in multiple charts shown at the same time
varName Name() + "_lastdt";

// read recorded date/time from last execution
recordedTimestamp NzStaticVarGetvarName ) );

// code runs conditionally only when new bar is detected
if( lastBarTime != recordedTimestamp )
{
    
// record new bar datetime
    
StaticVarSetvarNamelastBartime );

    
//////////////////////////////////////
    // main code here
    
PlaySound"c:\\windows\\media\\ding.wav" );
    
//////////////////////////////////////
}

// sample indicator code
PlotClose"Close"colorDefaultstyleBar )

Newer AmiBroker versions (>5.60) can use this for reading last bar timestamp (this is faster than using DateTime() function).
lastBartime Status("lastbarend")

How to increase maximum periods of built-in indicators

Built-in indicators and averages which are shipped with AmiBroker use Param() function calls to provide the ability to adjust parameter values through Parameters window. Param function in the code specifies default, minimum, maximum values for the input arguments.

The order of arguments in Param function is the following:

Param"name"defaultvalminmaxstepsincr 

In certain situations, we may however want to use larger period settings than the pre-defined maximum. There is an easy way to adjust the code to achieve such task. Let us consider using built-in Price (all in one) indicator and setting e.g. 200 or 300 periods for Bollinger Bands (default maximum is 100).

To modify the underlying code, we need to:

  1. Click on the chart with right mouse button and choose Edit Formula from the context menu to bring up the AFL code editor
  2. In the code identify Bollinger Band section and the Param function call responsible for setting number of periods and change it from 200 to 300 as shown in the picture below.

    Param call

  3. Approve the changes, by selecting Tools->Apply from the editor’s menu

Now we can go back to Parameters dialog and we will be able to set Bollinger Bands Periods setting up to 300 periods.

Positioning area plots behind the grid lines

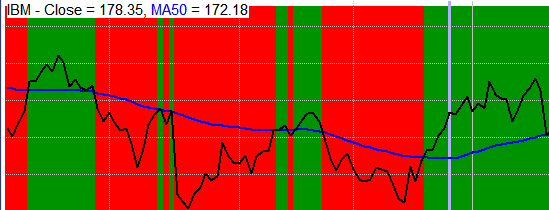
When we want to paint the background with custom colors to indicate certain states or conditions – we can use area plots style for this purpose. The code example presented below shows green background when Close stays above 50-period moving average and red when below MA-50.

PlotClose"Close"colorDefaultstyleThick);
PlotMA50 MA(Close,50), "MA50"colorBluestyleThick);

color IIfClose MA50colorGreencolorRed );
Plot1""colorstyleArea|styleOwnScale,0,)

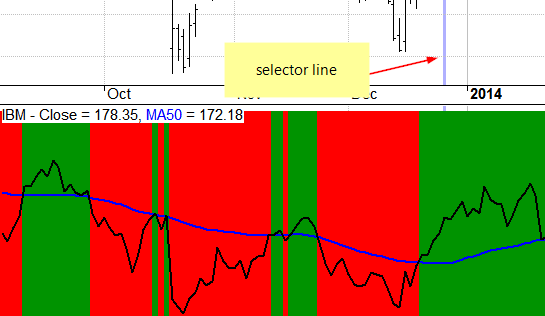
However – by default both grid lines and the selector line would get covered by the area plot:

area chart

There is an easy fix for that – AmiBroker allows to specify the Z-axis position too, so we can shift the visibility and order of plots (including their position against grids and other elements) by means of Z-order argument of Plot function.

If we specify the Z-order argument to -1 that means we move the particular plot one level behind and this would also be located below the grids.

PlotClose"Close"colorDefaultstyleThick);
PlotMA50 MA(Close,50), "MA50"colorBluestyleThick);

color IIfClose MA50colorGreencolorRed );
Plot1""colorstyleArea|styleOwnScale,0,1,0,-); // the 8th argument specifies z-orde

fixed z-order area chart

More information about use of Z-order can be found in the User’s Guide:
http://www.amibroker.com/guide/h_indbuilder2.html

High-Low of certain hours of the day

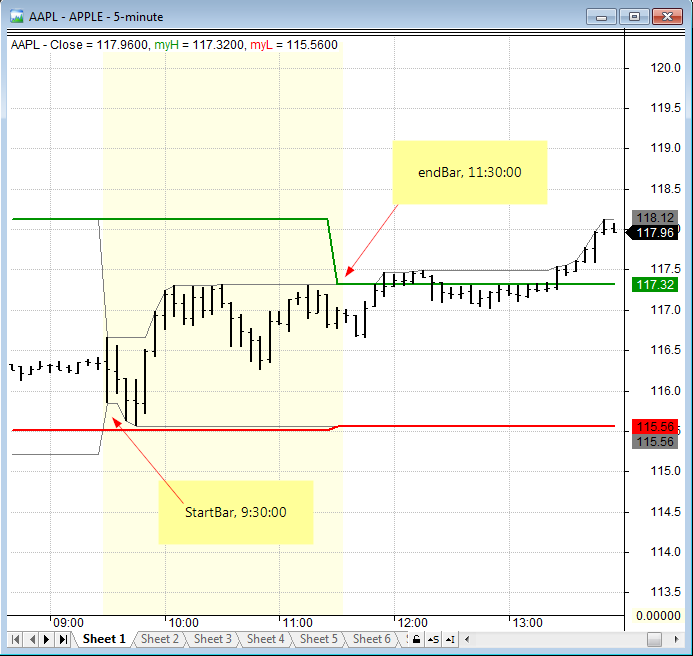
When we want to calculate high / low of selected hours of the trading session (e.g. first two trading hours), we can refer to TimeNum() function to identify timestamps of the bars. Then with use of HighestSince and ValueWhen functions we can obtain the high/low readings we need.

tn TimeNum();

// define start/end hours in TimeNum format
StartTime 93000;
Endtime 113000;

// these conditions are true when TimeNum of the bar equals startime/endtime
StartBar tn == StartTime;
EndBar tn == Endtime;

// on the end bar we read the value of highest high or lowest low since the start bar
myH ValueWhenEndBarHighestSinceStartBarHigh ) );
myL ValueWhenEndBarLowestSinceStartBarLow ) );

// display price and high / low arrays
PlotClose"Close"colorDefaultstyleBar|styleThick );
PlotmyH"myH"colorGreenstyleThick );
PlotmyL"myL"colorRedstyleThick );

// grey lines show how highest high / lowest low develop since start bar
PlotHighestSinceStartBarHigh ), ""colorgrey50 );
PlotLowestSinceStartBarLow ), ""colorgrey50 );

// area chart shows the zone we are reading our values from
Plottn >= StartTime AND tn <= Endtime""
      
ColorBlendcolorYellowcolorWhite0.9 ), 
      
styleArea styleOwnScale010, -1)

H-L from selected hours

Now we can use myH and myL arrays in strategies that e.g. check for breakouts from the first two hours of trading session etc.

It is important to remember that the code checks for equality, so the timestamps used in our charts must exactly match the time we specify in the code. The timestamp settings can be defined in Tools->Preferences->Intraday. The approach presented above uses 1-minute data and timestamps showing Start Time of Interval

Drawing indicators on a subset of visible bars

By default, the Plot function draws the graph for all visible bars. In some situations however, we may want to draw some selected bars, leaving remaining chart space unaffected.

To achieve that – we simply assign Null value for the bars that we want to skip. Our graph will just be drawn for the non-null bars.

This simple example draws candlesticks only on Mondays and leaves empty all the other days.

IsMonday DayOfWeek() == 1;
// assign Close for Mondays, otherwise assign Null
Data IIfIsMondayCloseNull );
// plot the data
PlotData"Chart of Mondays"colorDefaultstyleCandle )

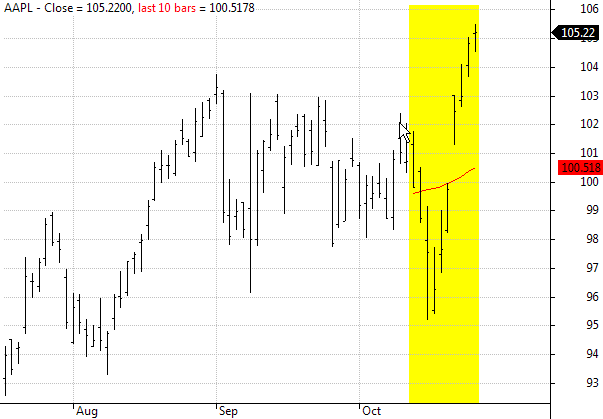
The following example shows how to restrict the visibility to last N bars. The code defines a custom function, which can be called later on for the arrays we want to show only partially.

// custom function definition
function LastNBars( array, bars )
{
    
bi BarIndex();
    
lvbi LastValuebi );

    
// use Null value for bars other than last N
    
return IIfbi lvbi bars, array, Null );
}

// price plot
PlotClose"Close"colorDefaultstyleBar );

// MA-50 restricted to last 10-bars only
line MAClose50 );
PlotLastNBarsline10 ), "last 10 bars"colorRed );

// shaded area
PlotLastNbarsTrue10 ), ""colorYellowstyleArea|styleOwnScale|styleNoLabel010, -)

Draw chart only for last N bars

In the above chart both Moving average (red line) and yellow shading area have been restricted to last 10-bars only.

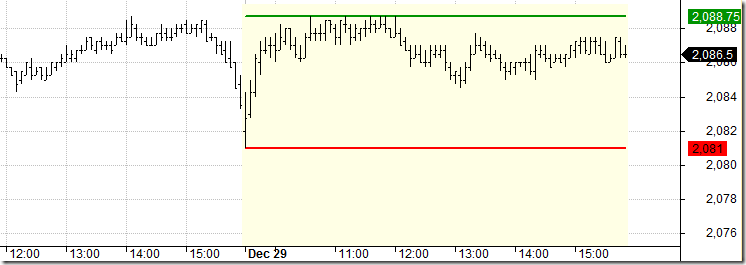
In a similar way we can restrict the visibility to most recent day only in intraday chart:

// custom function definition
function ShowLastDay( array )
{
    
dn datenum();
    
lastDay dn == LastValuedn );

    return 
IIflastDay, array, Null );
}

// price plot
PlotClose"Close"colorDefaultstyleBar );

// daily high / low on last day only
dailyH TimeFrameGetPrice("H"inDaily );
dailyL TimeFrameGetPrice("L"inDaily );
PlotShowLastDaydailyH ), "dailyH"colorGreenstyleThick  );
PlotShowLastDaydailyL ), "dailyL"colorRedstyleThick  );

// shaded area
colorPaleYellow ColorBlend(colorWhitecolorYellow0.1);
style styleArea styleOwnScale styleNoLabel;
PlotShowLastDay), ""colorPaleYellowstyle010, -)

Draw chart only for last day

Other practical implementations of such technique is presented in these formulas:
http://www.amibroker.com/kb/2007/03/24/how-to-plot-a-trailing-stop-in-the-price-chart/
http://www.amibroker.com/kb/2014/10/10/how-to-draw-regression-channel-programatically/

How to add full name to the Price chart title

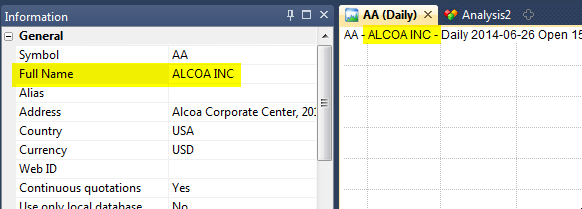
The full name of the security can be retrieved in AFL using FullName() function.

In order to add such information to the built-in Price chart, we need to do the following:

  1. Click on the chart with right mouse button
  2. Choose Edit Formula from the context menu
  3. Modify the Title definition line, the built-in code contains:_N(Title StrFormat("{{NAME}} - {{INTERVAL}} {{DATE}} Open %g, Hi %g, Lo %g, Close %g (%.1f%%)",
                         
    OHLCSelectedValueROCC) ) ))

    We need to change it into:

    _N(Title StrFormat("{{NAME}} - " +
                          
    FullName() +
                          
    " - {{INTERVAL}} {{DATE}} " +
                          
    "Open %g, Hi %g, Lo %g, Close %g (%.1f%%) Vol %.0f",
                          
    OHLCSelectedValueROCC) ), ) )
  4. To apply these changes choose Tools->Apply Indicator from the menu.

If we have Full name information imported into the database and visible in Symbol->Information window, the updated chart title will show it next to the ticker name.

Fullname in the chart title

Using loops with TimeFrame functions

AmiBroker features a powerful set of TimeFrame functions that allow combining different time intervals in single system formula. There is one aspect of TimeFrame functions that is important to understand to properly use them. When we switch to higher interval using TimeFrameSet function – the BarCount does not really change – TimeFrameSet just squeezes the arrays so we have first N-bars filled with Null values (undefined) and then – last part of the array contains the actual time-compressed values. This is explained in details here: http://www.amibroker.com/guide/h_timeframe.html

Normally it does not present any problem as long as we use array functions, because array functions check for Nulls occuring at the beginning of the data series and skip them appropriately. The story is different when we try to use loops.

If we want to use looping code in higher time-frame, we can not really start our calculations from the bar 0, because it would contain Null instead of real data. That is why we would first need to detect were the actual compressed data begins and start calculations on that particular bar instead.

Here is a sample formula showing how to compute AMA function in a loop, based on weekly data (the code should be applied in Daily interval). Code will identify the first non-Null bar and initialize the first AMA value with Close of that bar, then it will continue calculations

PlotClose"Close"colorBlack );

// switch to higher timeframe
TimeFrameSetinWeekly );

smooth 0.2;
myAMA Close;

// search for start (non-null) bar
for( start 0start BarCountstart++ )
{
   if( 
NOT IsNullClosestart ] ) ) break;
}

// looping code
for ( start 1BarCounti++ )
{
    
// this part will execute only after the first non-null bar has been identified
    
myAMA] = Close] * smooth myAMA] * ( smooth );
}

// regular AMA function for comparison
weeklyAMA AMAClose0.2 );

//restore original time-frame
TimeFrameRestore();

// plot expanded values retrieved from Weekly frame
PlotTimeFrameExpandmyAMAinWeekly ), "weekly AMA loop"colorRed );
PlotTimeFrameExpandweeklyAMAinWeekly ), "weekly AMA"colorBluestyleDots )

The code above is good for pre-5.90 versions. In version 5.90 we have a new function that counts Nulls for us making the code shorter and clearer, as shown below:

Version5.90 );

PlotClose"Close"colorBlack );

// switch to higher timeframe
TimeFrameSetinWeekly );

smooth 0.2;
myAMA Close;

// new 5.90 function that counts leading Nulls
start NullCountClose );

// looping code
for ( start 1BarCounti++ )
{
    
// this part will execute only after the first non-null bar has been identified
    
myAMA] = Close] * smooth myAMA] * ( smooth );
}

// regular AMA function for comparison
weeklyAMA AMAClose0.2 );

//restore original time-frame
TimeFrameRestore();

// plot expanded values retrieved from Weekly frame
PlotTimeFrameExpandmyAMAinWeekly ), "weekly AMA loop"colorRed );
PlotTimeFrameExpandweeklyAMAinWeekly ), "weekly AMA"colorBluestyleDots )

How to plot daily High and Low on intraday chart

The AFL offers a set of time-frame functions which allow to use multiple intervals within a single formula (the topic is explained in details in the following tutorial chapter: http://www.amibroker.com/guide/h_timeframe.html)

In situations, where we do not need to calculate any indicators based on higher interval data, but rather just read OHLC, V or OI arrays – TimeFrameGetPrice is the most convenient function to use.

To plot daily High and Low levels we just need to read the respective arrays calling: TimeFrameGetPrice(“H”, inDaily ) – the first argument specifies the array we want to read, the second argument defines the interval we are reading data from. As with any other TimeFrame functions – we can only read data from higher intervals, so it is possible to read daily data when we work with 1-minute quotes, but not the other way round.

Here is a sample formula which draws daily high and low in the intraday chart:

PlotClose"Close"colorDefaultstyleBar );
PlotTimeFrameGetPrice("H"inDaily ), "day high"colorGreenstyleStaircase styleThick);
PlotTimeFrameGetPrice("L"inDaily ), "day low"colorRedstyleStaircase styleThick)

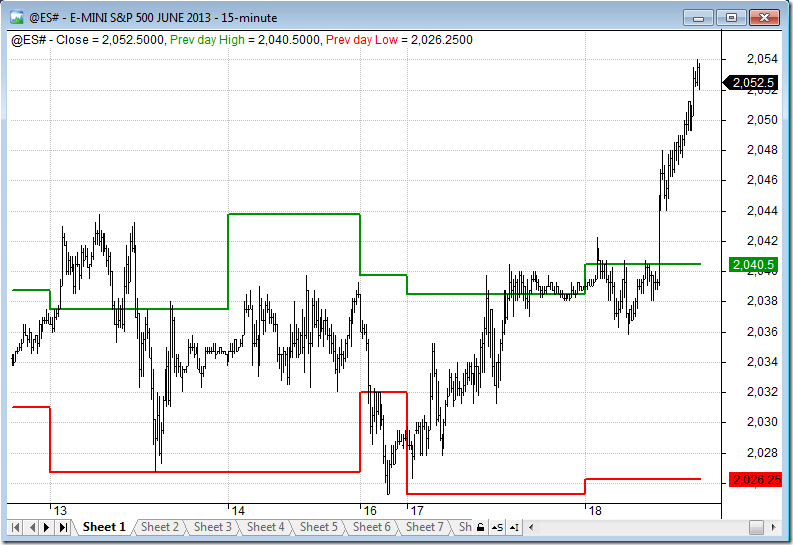
TimeFrameGetPrice() functions allow also to easily shift the reading by N-bars of the higher interval if we specify that in 3rd argument of the function, so calling TimeFrameGetPrice( “H”, inDaily, -1 ) will return the high of previous day.

The following code draws high / low of previous day on top of the intraday chart:

PlotClose"Close"colorDefaultstyleBar );
hlstyle styleStaircase styleThick;
PlotTimeFrameGetPrice"H"inDaily, -), "Prev High"colorGreenhlstyle );
PlotTimeFrameGetPrice"L"inDaily, -), "Prev Low"colorRedhlstyle )

Daily H-L

Next Page »