amibroker

HomeKnowledge Base

Separate ranks for categories that can be used in backtesting

When we want to develop a trading system, which enters only N top-scored symbols from each of the sectors, industries or other sub-groups of symbols ranked separately, we should build appropriate ranks for each of such categories. This can be done with ranking functionalities provided by StaticVarGenerateRanks function.

The formula presented below iterates though the list of symbols included in the test, then calculates the scores used for ranking and writes them into static variables. The static variables names are based on category number (sectors in this example) and that allows to create separate ranks for each sector.

// watchlist should contain all symbols included in the test
wlnum GetOption"FilterIncludeWatchlist" );
List = 
CategoryGetSymbolscategoryWatchlistwlnum ) ;

if( 
Status"stocknum" ) == )
{
    
// cleanup variables created in previous runs (if any)
    
StaticVarRemove"rank*" );
    
StaticVarRemove"values*" );
    
categoryList ",";

    for( 
0; ( Symbol StrExtract( List, ) )  != "";  n++ )
    {
        
SetForeignsymbol );

        
// use sectors for ranking
        
category sectorID();

        
// add sector to the list
        
if( ! StrFindcategoryList"," category "," ) ) categoryList += NumToStrcategory1) + ",";

        
// write our ranking criteria to a variable
        // in this example we will use 10-bar rate-of-change
        
values RocClose10 );

        
RestorePriceArrays();

        
// write ranked values to a static variable
        
StaticVarSet"values" category "_" symbolvalues );

    }

    
// generate separate ranks for each category from the list
    
for( 1; ( category StrExtractcategoryList) ) != ""i++ )
    {
        
StaticVarGenerateRanks"rank""values" category "_"01224 );
    }
}

category sectorID();
symbol Name();
Month();

values StaticVarGet"values" category "_" symbol );
rank StaticVarGet"rank" "values" category "_" symbol );

// exploration code for verification
AddColumnvalues"values" );
AddColumnrank"rank" );
AddTextColumnSectorID), "Sector" );
AddColumnSectorID(), "Sector No");
Filter rank <= 2;

if( 
Status"Action" ) == actionExplore SetSortColumns25);

// sample backtesting rules
SetBacktestModebacktestRotational );
score IIfrank <= 2values);
// switch symbols at the beginning of the month only
PositionScore IIf!= Refm, -), scorescoreNoRotate );
SetPositionSize1spsPercentOfEquity )

Our test should be applied to a watchlist, which contains all symbols we want to include in our ranking code:
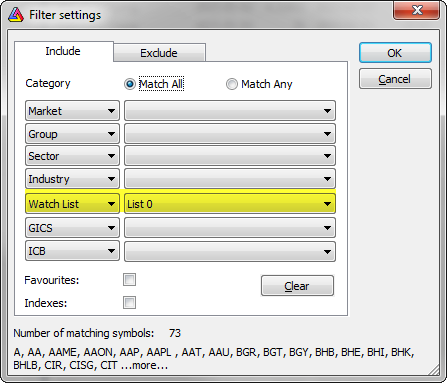
Watch list selection

Running the exploration will show two top-ranked symbols for each of the sectors:
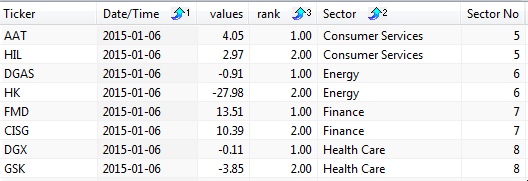
Ranking

We can also change Filter variable definition to

Filter 1

and show all ranked symbols instead.

Such ranking information can be used in backtest and sample rules included at the end of the code use rank information to allow only two top-scored symbols to be traded.

Ruin stop or mysterious Short(6) in the trade list

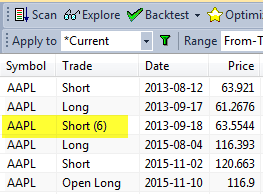
When you back-test a trading system, you may sometimes encounter trades marked with (6) exit reason, showing e.g.: Short (6) or Short (ruin) in the trade list as in the picture below:

Ruin stop in trade list

As explained in the this Knowledge Base article: http://www.amibroker.com/kb/2014/09/24/how-to-identify-which-signal-triggers/ such identifier tells us that the trade was closed because of the ruin stop activation.

A ruin-stop is a built-in, fixed percentage stop set at -99.96%, so it gets activated if your position is losing almost all (99.96%) of its entry value. It almost never occurs in long trades, but it may be quite common if your trading system places short trades without any kind of maximum loss stop. Imagine that you short a stock when its price is $10, then it’s price rises to $20 (twice the entry price). When you buy to cover the position you must pay $20 per share, which means that your loss on this trade is $10 per share ($20-$10). This means 100% loss (as per entry value). If you placed such a trade with all your capital you would be bankrupt. That is why this stop is called “ruin stop”. Unfortunately, by the nature of short selling, the gains are limited to 100% (when stock price goes down to zero) but losses are virtually unlimited.

So what to do to prevent exits by ruin stop?

The best idea is to just place proper max. loss stop at much smaller percentage (such as 10% or 20%) depending on what your risk tolerance is, to limit drawdowns and decrease the chance of wiping your account down to zero.

If, for some weird reason, you want to turn OFF this built-in stop, you can do so using this code:

SetOption"DisableRuinStop"True )

but it is highly discouraged, because when you wipe your account down to zero (or even below zero) it makes no point to run back-test any further. Instead of disabling this feature you should place proper, tighter maximum loss stop.

How does risk-mode trailing stop work?

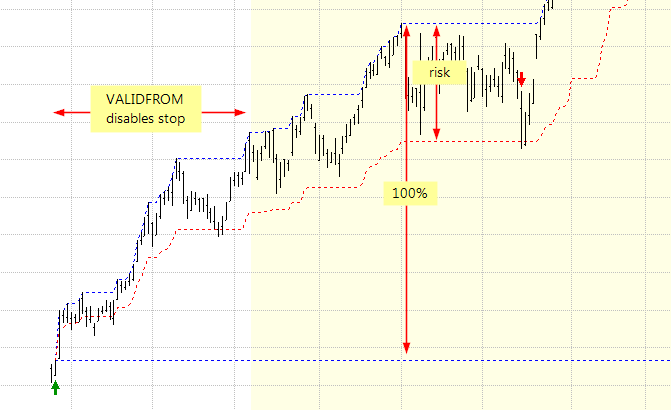
In addition to regular percent or point based stops, AmiBroker allows to define stop size as risk (stopModeRisk), which means that we allow only to give up certain percent of profit gained in given trade. The picture presented below visualizes a risk-mode trailing stop using 35% risk size. Since at the very beginning of the trade profits may be very low (and potentially triggering unwanted exits), this type of stop is best to use with validFrom argument, which allows to delay stop activation by certain number of bars.

The blue line on top represents highest high since entry, while red line shows the stop level calculation, yellow area shows the bars, where our stop has become active:

Risk-mode trailing stop

The above levels were calculated with the following code:

Buy DateNum() == 1140425// custom entry on a fixed date
Sell 0;
BuyPrice SellPrice close;

riskSize 35;
daysDelay 50;

ApplyStopstopTypeTrailingstopModeRiskriskSize1False0daysDelay );
Equity);

priceAtBuy ValueWhenBuyBuyPrice );
highsinceBuy HighestSinceBuyHigh);
stoplevel priceAtBuy + ( highsinceBuy priceAtBuy) * (100-riskSize)/100;

PlotClose"Close"colorDefaultstyleBar );
Plotstoplevel"stop"colorRedstyleDashed );
PlothighsinceBuy"highsinceBuy"colorBluestyleDashed );
PlotpriceAtBuy"priceAtBuy"colorBluestyleDashed );
PlotBarsSinceBuy ) > daysDelay""ColorBlendcolorYellowcolorWhite,0.9), styleArea|styleOwnScale,0,1,0,-1);

PlotShapes(Buy*shapeUpArrowcolorGreen0Low);
PlotShapesIIfSellshapeDownArrowshapeNone), colorRed0High)

How to write to single shared file in multi-threaded scenario

The problem is as follows: during multiple-symbol Scan (or any other multi-threaded Analysis operation) we want to create a single, shared file and append content generated from multiple symbols to it.

There are two things that we must consider if we are running in multiple treaded scenario.
1. If we want to get just single-run results, before appending content to the file, we need first to delete file generated in previous runs.

2. We have to take care to open the file in share-aware mode so multiple threads do not write at the same time (preventing corruption).

A sample formula is presented below.

// our scanning code
Buy CrossMACD(), Signal() );

filepath "C:\\ScanExport.txt";

if( 
Status("stocknum") == )
{
   
// delete previous file before anything else
   
fdeletefilepath );
}

// open file in "share-aware" append mode
fh fopenfilepath"a"True );

// proceed if file handle is correct
if ( fh )
{
   
lastbuyDT =  LastValueValueWhenBuyDateTime() ) ) ;

   
// write to file
   
fputsName() +", Last Buy: " DateTimeToStrlastBuyDT ) +"\n"fh );

   
// close file handle
   
fclosefh );
}
else
{
  
_TRACE("Failed to open the file");

One important thing to remember is that in multi-threaded environment threads execute independently and there is no guarantee they will all execute sequentially, so the order of items (symbols) in the file may not be alphabetical.

If we want strictly sequential execution, then we must limit ourselves to just running in single-thread. A single-thread execution in New Analysis window can be achieved by placing the following pragma call at the top of the formula.

#pragma maxthreads 

#pragma maxthreads limits the number of parallel threads used by New Analysis window. This command is available in AmiBroker version 6 or higher.

How to show price ratio between two symbols

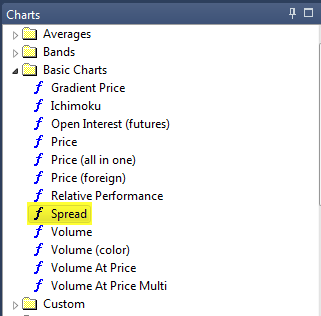
Charting ratios between the prices of two symbols can easily be done with AmiBroker. For this purpose we can use Spread built-in formula available in Charts window:

Inserting Spread formula

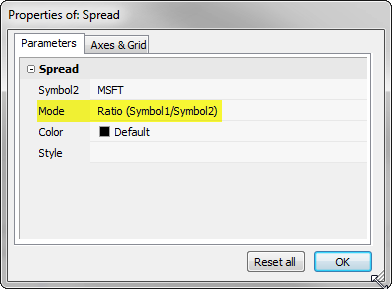
Then select the style as Ratio:

Parameter window

The primary symbol (Symbol1) is the one selected in the chart window, the other symbol (Symbol2) is defined in the Parameters window, as presented in the above screenshot.

It is also possible to create such ratio chart programmatically in AFL using the following code:

ratio Foreign("Symbol1""C") / Foreign("Symbol2""C");
Plotratio"ratio"colorRed )

Symbol1 and symbol2 names in the above code need to be replaced with the actual symbol names from our database we want to use.

How to read highest high value of future bars

Built in HHV and LLV functions allow to read highest high or lowest low of n-past bars. If we want to refer to future values, there is an easy way to do it using simple Ref function and just shift HHV or LLV reading from N-bars ahead. A ready to use function showing such approach is presented below:

// function definitions
function futureHHV( array, periods )
{
   return 
RefHHV( array, periods ), periods );
}
function 
futureLLV( array, periods )
{
   return 
RefLLV( array, periods ), periods );
}

// sample use
PlotClose"Close"colorDefaultstyleBar );
PlotHHVH20 ), "HHV"colorGreenstyleDashed );
PlotfutureHHVH20 ), "Future HHV"colorGreenstyleThick );
PlotLLVL20 ), "LLV"colorRedstyleDashed );
PlotfutureLLVL20 ), "Future LLV"colorRedstyleThick )

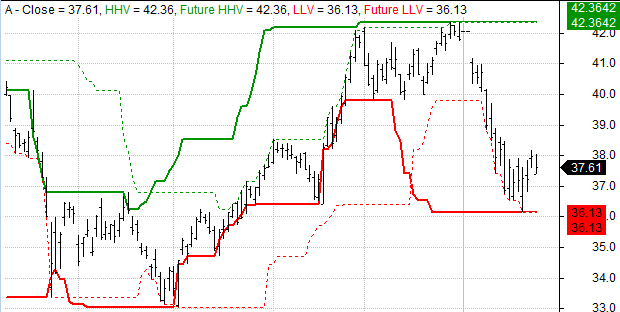
And here is the chart produced by the formula above:

Future HHV

How to count symbols in given category

When we want to find out how many symbols belong to given category (such as watchlist) then for manual inspection, it is enough to hover the mouse cursor over the particular category name in the Symbols window and the information will be shown in a tooltip:

Category symbol count

If we want to check such information using AFL code, we could read the list of symbols returned with CategoryGetSymbols and by counting commas (which separate symbol names) find out the number of tickers.

A reusable function is presented below:

function CategoryCountSymbolscategorynumber )
{
   
count StrCount( list = CategoryGetSymbolscategorynumber ), ",");
   return 
IIf( list == ""0count );
}    

Title "Symbols in watchlist 0: " CategoryCountSymbolscategoryWatchlist)

How to create custom import definition for ASCII importer

When we use File->Import ASCII to import data, we can choose import file format using one pre-defined import format definitions. As it is explained in the manual (http://www.amibroker.com/guide/d_ascii.html) it is also possible to create our custom import definitions to match data we are trying to import. This article explains all the required steps.

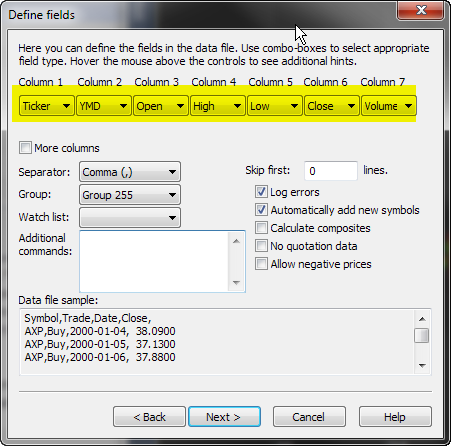
The easiest method to create import definition is to use File->Import Wizard. In the first page, select at least one file in the format we want to import and on the second page configure columns:

Import Wizard page 2

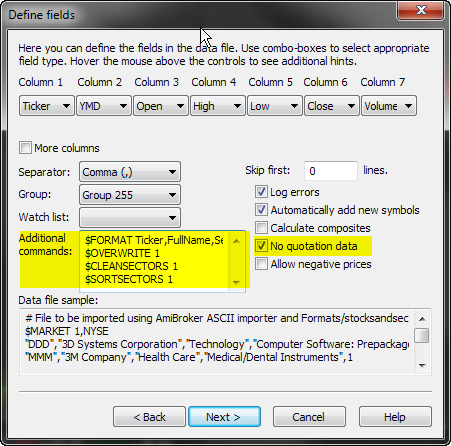
This all easy when we are importing quotation data, but when we are importing non-quotation data such as category assignments, we can not select appropriate columns using Import Wizard. In such case we need to type-in appropriate $FORMAT command in the “Additional commands” field of Import Wizard.

For example if we have file with categories like this:

"DDD","3D Systems Corporation","Technology","Computer Software: Prepackaged Software",1
"MMM","3M Company","Health Care","Medical/Dental Instruments",1
"WBAI","500.com Limited","Consumer Services","Services-Misc. Amusement & Recreation",1
"WUBA","58.com Inc.","Technology","Computer Software: Programming, Data Processing",1
"AHC","A.H. Belo Corporation","Consumer Services","Newspapers/Magazines",1
"ATEN","A10 Networks, Inc.","Technology","Computer Communications Equipment",1
"AIR","AAR Corp.","Capital Goods","Aerospace",1
"AAN","Aaron's,  Inc.","Technology","Diversified Commercial Services",1

We need to add the following commands in the “Additional commands” field of Import Wizard

$FORMAT Ticker,FullName,SectorName,IndustryName,Group
$OVERWRITE 1
$CLEANSECTORS 1
$SORTSECTORS 1

First line tells AmiBroker the column meaning, second line tells it to overwrite existing data. Last two lines tell AmiBroker to wipe existing category structure and sort imported sectors alphabetically. Be sure NOT to specify $CLEANSECTORS command when you do NOT want to wipe existing category structure.

We also need to mark “No quotation data” box in the second page of Import wizard to tell AmiBroker that the file that we are importing does not contain quotes and it should switch off all price checking.

Import Wizard page 2

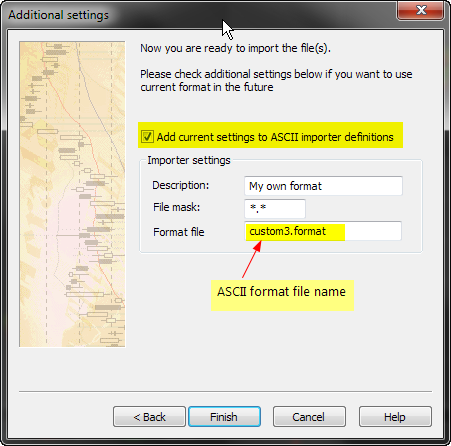
Finally, in the last step of the wizard save the format definition:

Import Wizard page 3

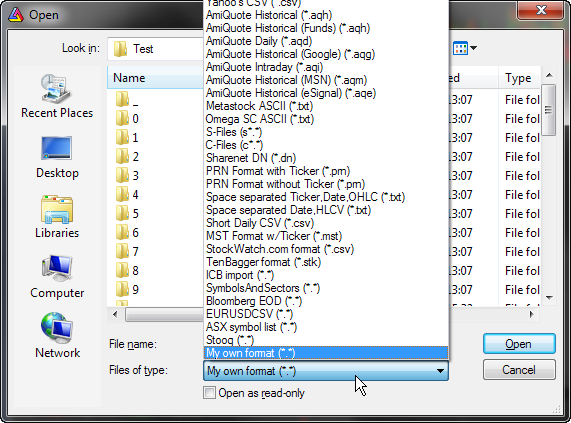
Once we do this, next time we use File->Import ASCII a new selection My own format will appear in the Files of type combo box in the file selector dialog.

Import ASCII

It is worth noting that import definitions are plain text files that are stored in “Formats” subfolder of AmiBroker directory, and the list of available import definitions that appears in “Files of type” combo box, is also a plain text file called “import.types” that is located in the same subfolder. So, advanced users may also modify those files directly using plain text editor such as Notepad. It is all explained in great detail in the manual http://www.amibroker.com/guide/d_ascii.html

How to fill background between hand-drawn trend lines

Among built-in drawing tools, the Triangle, Rectangle and Ellipse allow to fill the background with custom color. However, if we wanted to fill the space between manually drawn trend lines, then we could use AFL formula with Study function that allows to detect the position of the line. Then – knowing the arrays of top and bottom lines we could fill the area between with a cloud plot.

A sample formula, which shows such implementation is presented below. The code fills the space between L1 and L2 trendlines (red color) and between upper and lower bands of the regression channel (RU and RL study id’s respectively).

// regular price plot
PlotClose"Close"colorDefaultstyleBar );

// custom function definition
function FillSpaceID1ID2color )
{
   
// get current chart ID
   
chartID GetChartID();

   
// read the positions of the lines
   
l1 Study(ID1chartID );
   
l2 Study(ID2chartID );

   
// draw cloud chart
   
PlotOHLCl1l1l2l2""ColorBlend(colorGetChartBkColor() ), styleCloud|styleNoRescale|styleNoLabelNullNull0, -);
}

// call function and refer to the assigned study ID's
FillSpace"L1","L2"colorRed );
FillSpace"RU","RL"colorBlue )

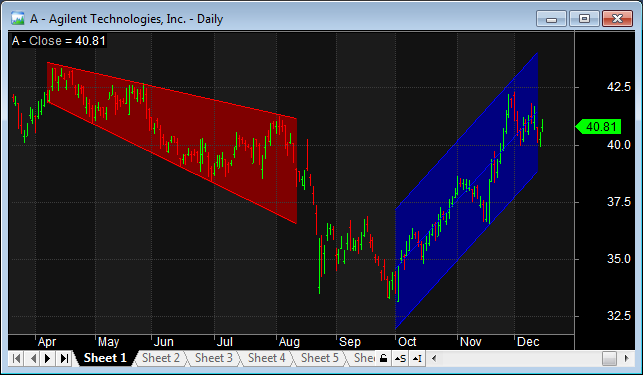
The chart produced by the formula looks as follows:

Chart with background fill

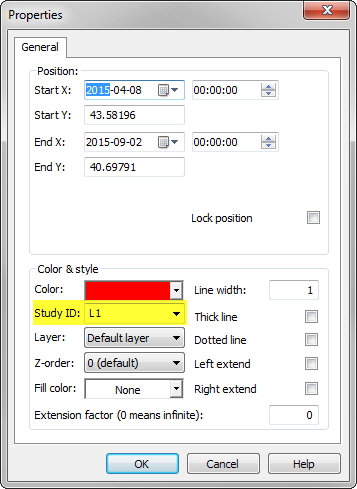
We need to remember that each line needs to have unique Study ID assigned in the Properties window.

Properties window

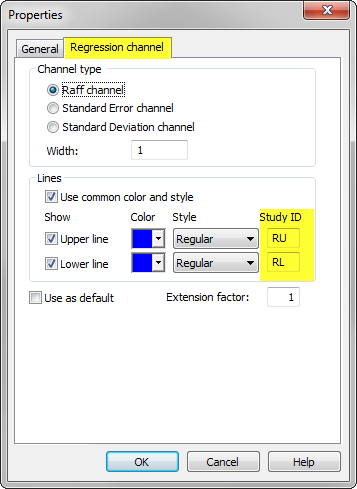
In case of regression channel the ID’s of the upper and lower lines are defined in Regression Channel tab:

Properties window

If we wanted to handle more lines, then it may be more practical to process the list of study ID’s defined in a custom string instead of individual function calls.

// regular price plot
PlotClose"Close"colorDefaultstyleBar );

// custom function definition
function FillSpaceID1ID2color )
{
   
// get current chart ID
   
chartID GetChartID();

   
// read the positions of the lines
   
l1 Study(ID1chartID );
   
l2 Study(ID2chartID );

   
// draw cloud chart
   
PlotOHLCl1l1l2l2""ColorBlend(colorGetChartBkColor() ), styleCloud|styleNoRescale|styleNoLabelNullNull0, -);
}

function 
BulkFillIDlistcolor )
{
    for( 
0; ( ID1 StrExtractIDlist) ) != ""+= )
    {
      
ID2 StrExtractIDlisti+);
      
FillSpaceID1,ID2color );
    }
}

// call function and refer to the assigned study ID's
BulkFill"L1,L2,RU,RL,R1,R2"colorRed )

How to combine multiple databases into one

In order to combine data stored in two separate databases within a single database we may consider one of the following options:

ASCII IMPORT/EXPORT METHOD

First of the possible ways is to export data from one database into CSV files using the procedure presented here:

http://www.amibroker.com/kb/2006/03/04/how-to-export-quotations-from-amibroker-to-csv-file/

Once we have our quotations exported into text files, we can load the other database and use built in ASCII importer to import data. The detailed procedure is outlined in the following Knowledge Base Article:

http://www.amibroker.com/kb/2014/12/29/importing-data-using-multiple-column-separators/

FILE COPY METHOD

Another way of combining the databases is to copy the individual symbols files. Each database stores individual data files within 0-9,a-z,”_” subfolders and it is possible to copy the individual data files between databases. When copying, we need to maintain the same folder pattern and copy symbols from “a” subfolder of one database into “a” subfolder of the other database (the same for other folders), so each of the symbols would land in its respective folder.

After we copy the data files, we also need to delete broker.master file from the target database folder. This is because this file stores pre-generated symbol list used for fast loading. When we delete the file, it will be reconstructed based on information from individual data files.

More information about the database structure can be found in the manual:
http://www.amibroker.com/guide/h_workspace.html

Next Page »