May 14, 2007
How to detect the study crossover for multiple symbols with use of SCAN
It’s possible to use Automatic Analysis window to search for trendline (or other study) crossovers for multiple symbols at once. It’s necessary to do the following:
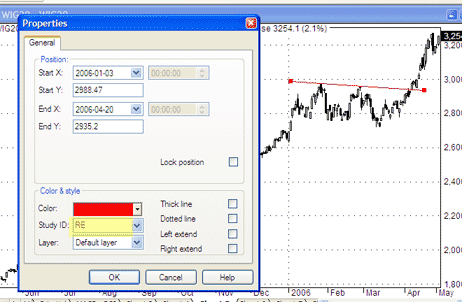
1. Draw trendlines on the chart and assidn them a STUDY ID – two letter code that allows to recognise the particular study. To do this, go to study properties (Alt+Enter) after you draw the line (in this example – StudyID = “RE”).
2. Repeat the process for other symbols (remember to draw the trendlines in the same chart pane).
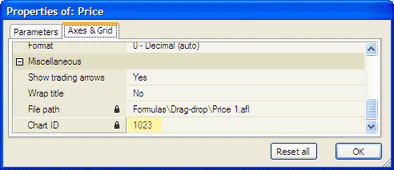
3. Check the CHART ID (in order to call this particular chart pane from the SCAN). To check the ChartID – click on the chart with right mouse button, go to: PARAMETERS -> Axes&Grid (in this example – CHARTID = 1023).
4. Now we can write the formula:
– Analysis -> Formula Editor
– enter:
Buy = Cross( Close, Study(“RE”, 1023) );
(note that we use the same StudyID and ChartID in the formula)
– Tools -> Send to analysis.
– Apply To: All Symbols, All Quotations
– press SCAN
 Filed by AmiBroker Support at 2:35 am under Charting,Exploration
Comments Off on How to detect the study crossover for multiple symbols with use of SCAN

