Using studies in AFL formulas
AmiBroker 3.52 introduces ability to reference hand-drawn studies from AFL
formulas. This feature is quite unique among trading software and as you will
find out using this feature is quite easy.
I will show you an example how to check if the trend line is broken from AFL
code. All we need to do is three simple steps:
- Draw a trend line
- Define study ID
- Write the formula that checks trend line break
Drawing trend line
|
A trend line is a sloping line drawn between two prominent points on
a chart.
In this example we will draw the rising trend line that defines the uptrend.
This kind of trend line is usually drawn between two (or more) troughs
(low points) to illustrate price support.
For sure you know how to draw a trend line in AmiBroker - just select
a "Trend line" tool from "Draw" toolbar, find at least
two recent troughs and just draw the line.
|
|
Define study ID
|
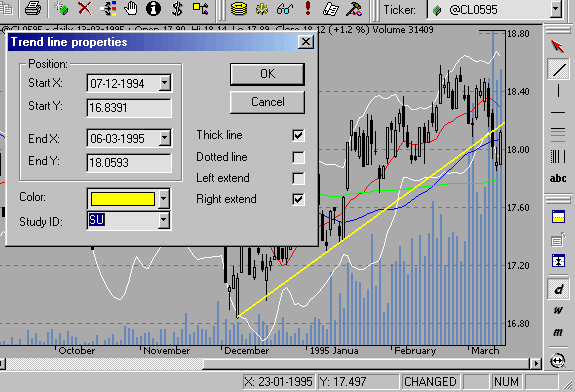
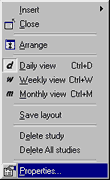
As you probably know, you can modify the properties of each line drawn
in AmiBroker by clicking with the right mouse button over the study and
selecting "Properties" from the menu. The properties dialog
that shows up allows you to define exact start/end points and choose line
colour, style and left and/or right extension mode.
For further analysis we will use the right-extended trend line (click
on appropriate checkbox) to make sure that the trend line is automaticaly
extended when new data are added.
|
|
Since version 3.52 the properties dialog allows also to define "Study
ID" (the combo below colour box). "Study ID" is a two-letter
code of the study that can be assigned to any study within a chart that allows
AmiBroker to reference it from AFL. Predefined identifiers are: "UP"
- uptrend, "DN" - downtrend, "SU" - support, "RE"
- resistance, "ST" - stop loss, however you can use ANY identifiers
(there are no limitations except that AmiBroker accepts only 2 letter codes).
This way if you draw the support lines in many symbols and give them all "SU"
identifier then you will be able to reference the support line from AFL code.

So we will assign the "SU" study ID to the rising support trend
line we have just drawn.
Write the formula that checks trend line break
In this example we will detect if the closing price drops BELOW support trend
line. This is actually very simple:
Sell = Cross( Study( "SU", GetChartID()
  ), Close );
Note that study() function accepts two arguments: the first is StudyID two
letter code that corresponds to one given in properites dialog; the second
argument
is chart ID - it should be taken either via GetChartID() function (then it
refers to current indicator) or read from Parameter
dialog, Axes & Grid: Miscellaneous:
Chart ID.


